> ## Documentation Index
> Fetch the complete documentation index at: https://www.siya.com/llms.txt
> Use this file to discover all available pages before exploring further.

# Boiler Cooling Monitor

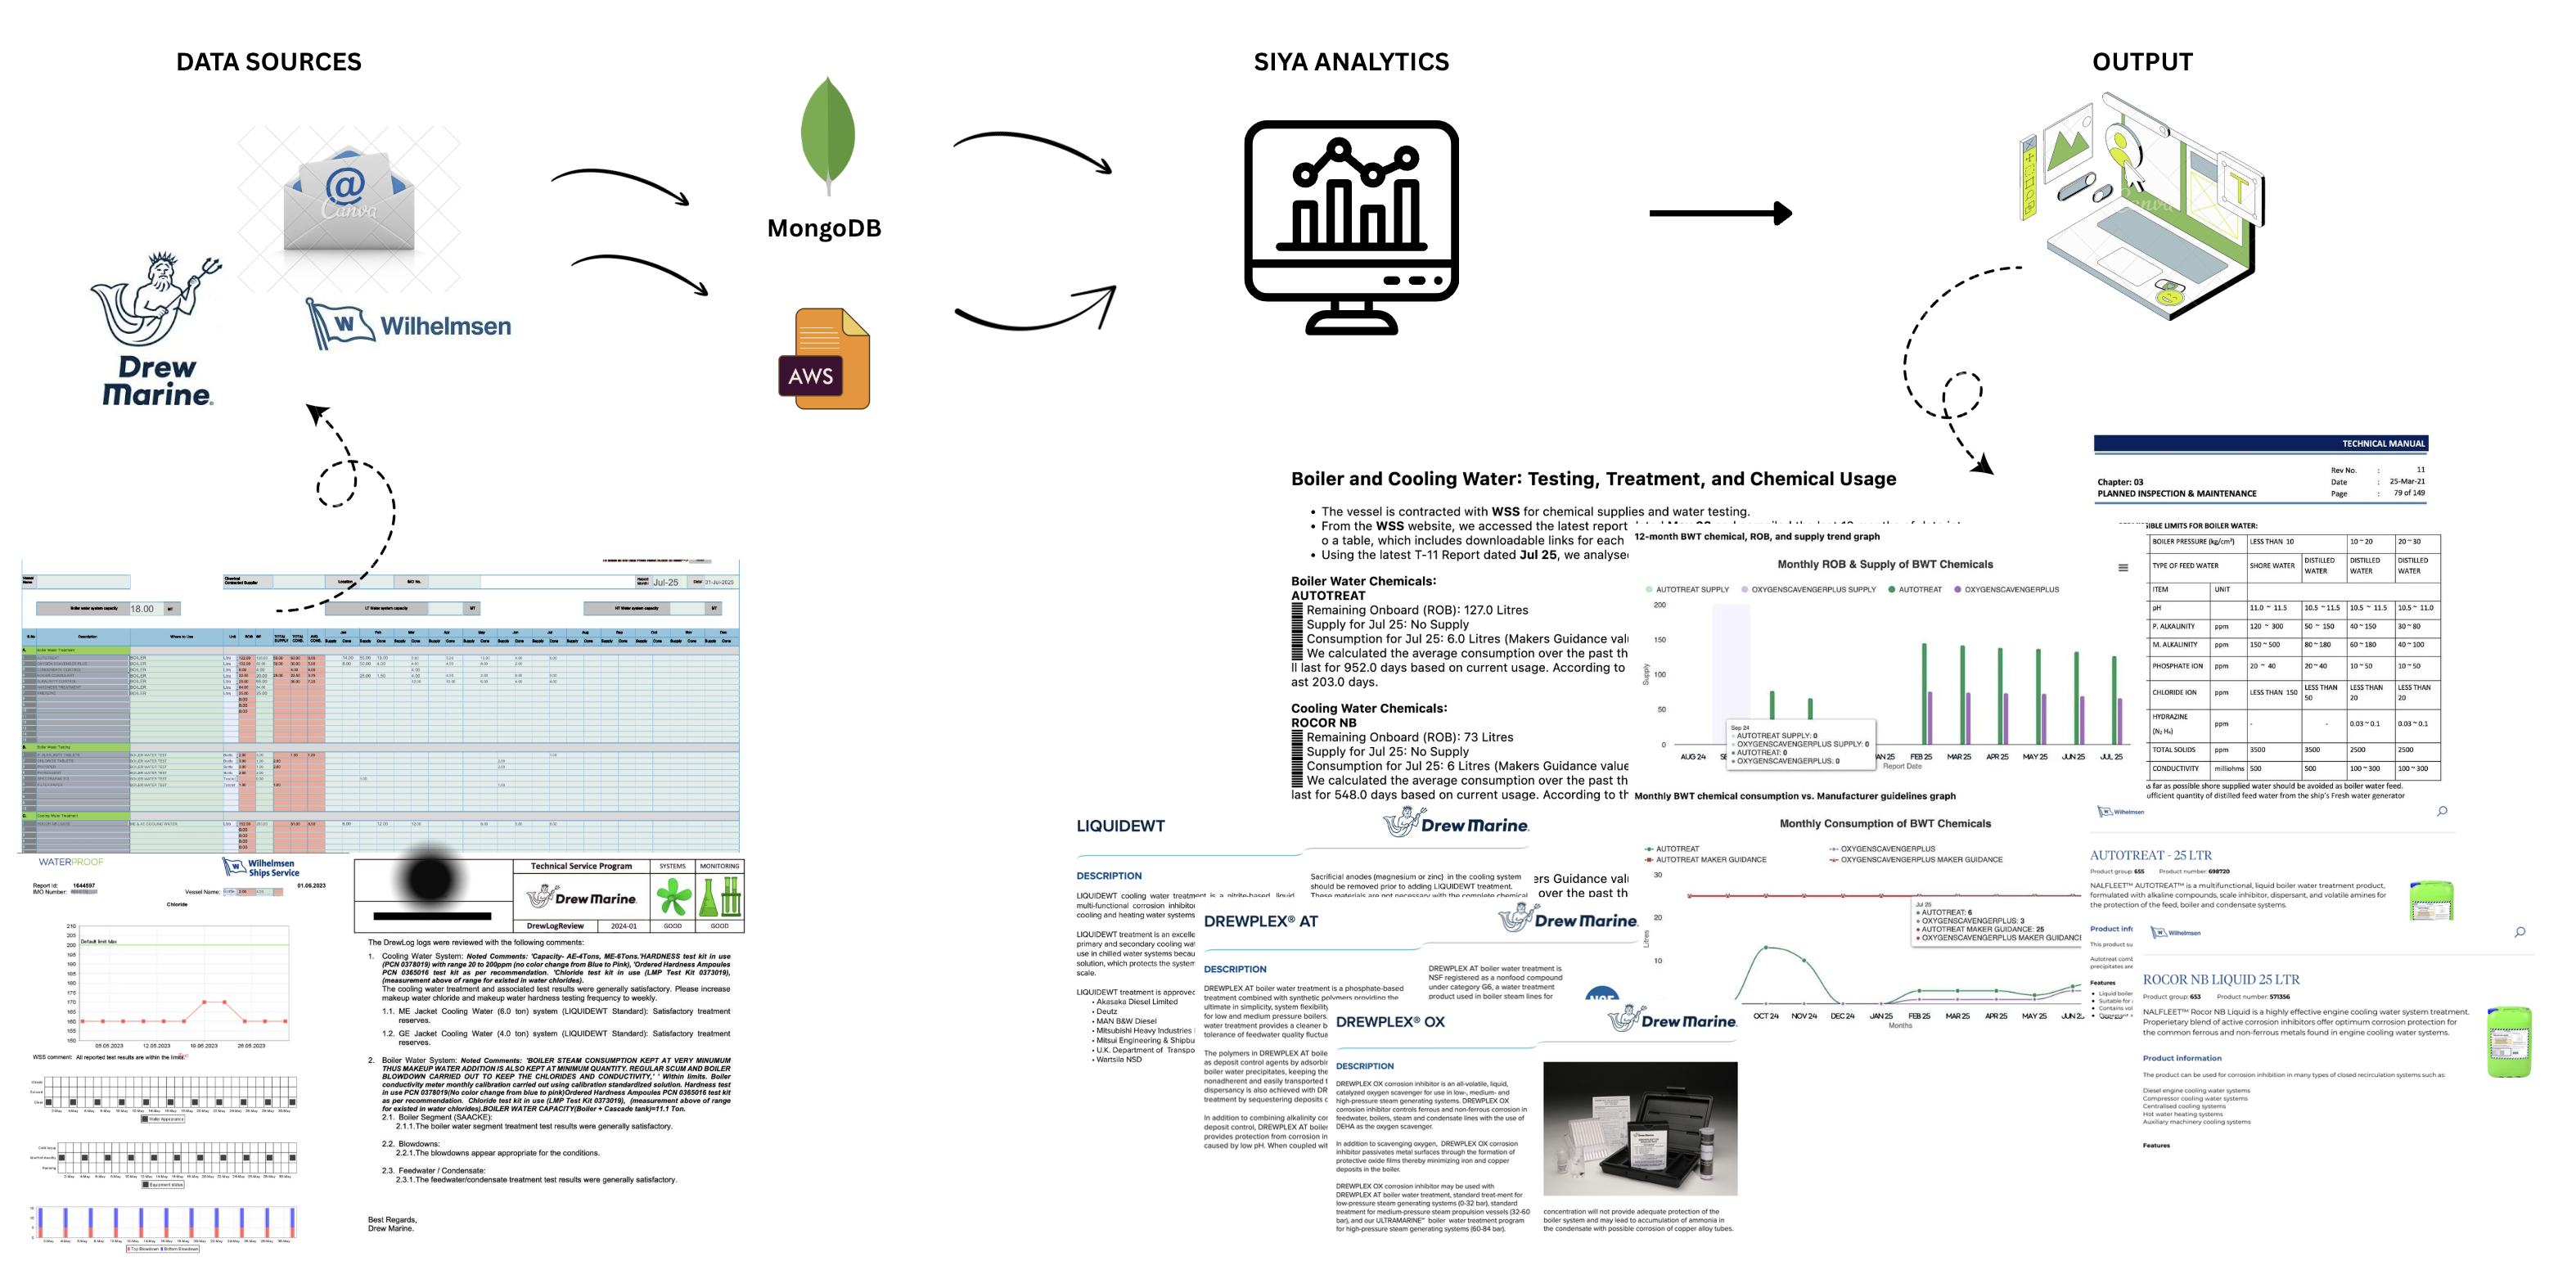
> This document details the advanced **Boiler and Cooling Water Treatment (BWT & CWT)** monitoring system, an analytics platform for maritime vessels. It provides real-time chemical inventory management, consumption tracking, and predictive analytics to optimize water treatment performance and ensure operational efficiency across your fleet.

export const SystemFlowchart = () => {
  const handleBoxClick = title => {
    alert(`More details on: ${title}`);
  };
  const flowchartStyles = {
    flowchartBody: {
      fontFamily: "'Segoe UI', system-ui, -apple-system, BlinkMacSystemFont, 'Helvetica Neue', Arial, sans-serif",
      backgroundColor: '#f8f9fa',
      color: '#343a40',
      padding: '8px 1px',
      margin: 0,
      display: 'flex',
      flexDirection: 'column',
      alignItems: 'center',
      overflowX: 'hidden'
    },
    h1: {
      fontWeight: 600,
      color: '#212529',
      marginBottom: '10px',
      textAlign: 'center',
      fontSize: '1.3rem'
    },
    flowchartContainer: {
      display: 'flex',
      justifyContent: 'center',
      alignItems: 'flex-start',
      width: '100%',
      padding: '5px 0'
    },
    flowchartStage: {
      display: 'flex',
      flexDirection: 'column',
      alignItems: 'center',
      margin: '0 2px',
      width: '95px',
      flexShrink: 0
    },
    flowchartStageTitle: {
      fontWeight: 600,
      color: '#5e6c84',
      marginBottom: '6px',
      textTransform: 'uppercase',
      fontSize: '0.6rem',
      letterSpacing: '0.4px',
      textAlign: 'center'
    },
    flowchartBox: {
      backgroundColor: '#ffffff',
      color: '#343a40',
      fontWeight: 600,
      padding: '5px 3px',
      borderRadius: '3px',
      textAlign: 'center',
      marginBottom: '5px',
      width: '100%',
      boxShadow: '0 1px 2px rgba(0, 0, 0, 0.06)',
      border: '1px solid #dee2e6',
      minHeight: '55px',
      fontSize: '0.65rem',
      transition: 'transform 0.2s ease, box-shadow 0.2s ease',
      cursor: 'pointer',
      display: 'flex',
      flexDirection: 'column',
      alignItems: 'center',
      justifyContent: 'center'
    },
    flowchartBoxHover: {
      transform: 'translateY(-2px)',
      boxShadow: '0 2px 5px rgba(0, 0, 0, 0.1)'
    },
    flowchartArrow: {
      fontSize: '1.4rem',
      color: '#adb5bd',
      display: 'flex',
      alignItems: 'center',
      justifyContent: 'center',
      padding: '0 4px',
      marginTop: '104px'
    },
    icon: {
      fontSize: '1.1rem',
      marginBottom: '4px'
    },
    span: {
      lineHeight: 1.2
    }
  };
  const getBoxStyle = category => ({
    ...flowchartStyles.flowchartBox,
    borderTop: `2px solid ${category === 'inputs' ? '#4a90e2' : category === 'processing' ? '#9013fe' : category === 'analytics' ? '#50e3c2' : category === 'outputs' ? '#f5a623' : category === 'users' ? '#d0021b' : '#dee2e6'}`
  });
  const getIconStyle = category => ({
    ...flowchartStyles.icon,
    color: category === 'inputs' ? '#4a90e2' : category === 'processing' ? '#9013fe' : category === 'analytics' ? '#50e3c2' : category === 'outputs' ? '#f5a623' : category === 'users' ? '#d0021b' : '#343a40'
  });
  return <>
      <link rel="stylesheet" href="https://cdnjs.cloudflare.com/ajax/libs/font-awesome/6.5.1/css/all.min.css" />
      <div style={flowchartStyles.flowchartBody}>
        <h1 style={flowchartStyles.h1}>Maritime Chemical Management: System Process Flow</h1>
        <div style={flowchartStyles.flowchartContainer}>
          <div style={flowchartStyles.flowchartStage}>
            <div style={flowchartStyles.flowchartStageTitle}>1. Inputs</div>
            <div style={getBoxStyle('inputs')} onClick={() => handleBoxClick('Vessel Operations Reports')}>
              <i className="fas fa-ship" style={getIconStyle('inputs')}></i>
              <span style={flowchartStyles.span}>Vessel<br />Reports</span>
            </div>
            <div style={getBoxStyle('inputs')} onClick={() => handleBoxClick('Shore Service Reports')}>
              <i className="fas fa-file-alt" style={getIconStyle('inputs')}></i>
              <span style={flowchartStyles.span}>Shore<br />Reports</span>
            </div>
            <div style={getBoxStyle('inputs')} onClick={() => handleBoxClick('Chemical Supplier Data')}>
              <i className="fas fa-flask" style={getIconStyle('inputs')}></i>
              <span style={flowchartStyles.span}>Supplier<br />Data</span>
            </div>
          </div>
          
          <div style={flowchartStyles.flowchartArrow}>→</div>
          
          <div style={flowchartStyles.flowchartStage}>
            <div style={flowchartStyles.flowchartStageTitle}>2. Processing</div>
            <div style={getBoxStyle('processing')} onClick={() => handleBoxClick('Data Integration & Validation')}>
              <i className="fas fa-cogs" style={getIconStyle('processing')}></i>
              <span style={flowchartStyles.span}>Integration<br />& Validation</span>
            </div>
            <div style={getBoxStyle('processing')} onClick={() => handleBoxClick('Chemical Analysis')}>
              <i className="fas fa-vial" style={getIconStyle('processing')}></i>
              <span style={flowchartStyles.span}>Chemical<br />Analysis</span>
            </div>
            <div style={getBoxStyle('processing')} onClick={() => handleBoxClick('ROB Calculations')}>
              <i className="fas fa-calculator" style={getIconStyle('processing')}></i>
              <span style={flowchartStyles.span}>ROB<br />Calculations</span>
            </div>
          </div>
          
          <div style={flowchartStyles.flowchartArrow}>→</div>
          
          <div style={flowchartStyles.flowchartStage}>
            <div style={flowchartStyles.flowchartStageTitle}>3. Analytics</div>
            <div style={getBoxStyle('analytics')} onClick={() => handleBoxClick('Predictive Models & Forecasting')}>
              <i className="fas fa-chart-line" style={getIconStyle('analytics')}></i>
              <span style={flowchartStyles.span}>Predictive<br />Models</span>
            </div>
            <div style={getBoxStyle('analytics')} onClick={() => handleBoxClick('Compliance Monitoring')}>
              <i className="fas fa-shield-alt" style={getIconStyle('analytics')}></i>
              <span style={flowchartStyles.span}>Compliance<br />Monitoring</span>
            </div>
            <div style={getBoxStyle('analytics')} onClick={() => handleBoxClick('Performance Metrics')}>
              <i className="fas fa-tachometer-alt" style={getIconStyle('analytics')}></i>
              <span style={flowchartStyles.span}>Performance<br />Metrics</span>
            </div>
          </div>
          
          <div style={flowchartStyles.flowchartArrow}>→</div>
          
          <div style={flowchartStyles.flowchartStage}>
            <div style={flowchartStyles.flowchartStageTitle}>4. Outputs</div>
            <div style={getBoxStyle('outputs')} onClick={() => handleBoxClick('Interactive Dashboards')}>
              <i className="fas fa-chart-pie" style={getIconStyle('outputs')}></i>
              <span style={flowchartStyles.span}>Dashboards</span>
            </div>
            <div style={getBoxStyle('outputs')} onClick={() => handleBoxClick('Automated Reports')}>
              <i className="fas fa-file-invoice" style={getIconStyle('outputs')}></i>
              <span style={flowchartStyles.span}>Auto<br />Reports</span>
            </div>
            <div style={getBoxStyle('outputs')} onClick={() => handleBoxClick('Alert Systems')}>
              <i className="fas fa-bell" style={getIconStyle('outputs')}></i>
              <span style={flowchartStyles.span}>Alerts</span>
            </div>
          </div>
          
          <div style={flowchartStyles.flowchartArrow}>→</div>
          
          <div style={flowchartStyles.flowchartStage}>
            <div style={flowchartStyles.flowchartStageTitle}>5. End Users</div>
            <div style={getBoxStyle('users')} onClick={() => handleBoxClick('Fleet Managers')}>
              <i className="fas fa-user-tie" style={getIconStyle('users')}></i>
              <span style={flowchartStyles.span}>Fleet<br />Managers</span>
            </div>
            <div style={getBoxStyle('users')} onClick={() => handleBoxClick('Vessel Operations Teams')}>
              <i className="fas fa-users-cog" style={getIconStyle('users')}></i>
              <span style={flowchartStyles.span}>Vessel<br />Operations</span>
            </div>
            <div style={getBoxStyle('users')} onClick={() => handleBoxClick('Compliance Teams')}>
              <i className="fas fa-user-shield" style={getIconStyle('users')}></i>
              <span style={flowchartStyles.span}>Compliance<br />Teams</span>
            </div>
          </div>
        </div>
      </div>
    </>;
};

## System Flow Overview

<div style={{ display: 'flex', alignItems: 'center', gap: '20px' }}>
  <img src="https://mintcdn.com/siya-6e67d02e/W6g_Ki8M7xLfD1eQ/assets/bwtdashboard.png?fit=max&auto=format&n=W6g_Ki8M7xLfD1eQ&q=85&s=91285d26dff4a40985f68e6bba72b7b0" alt="Drew Marine Logo" width="800" data-path="assets/bwtdashboard.png" />
</div>

### Integrated Methods

<SystemFlowchart />

## Detailed Data Processing Workflow

The system excels at transforming unstructured data from operational reports into actionable intelligence. The automated workflow is as follows:

#### 1. Data Ingestion

An automated service monitors an inbox for key documents, including **T-11 Chemical Inventory forms**, monthly testing logs, and service reports, typically sent as PDF attachments.

#### 2. Secure Storage

Incoming files are immediately archived in a secure AWS S3 bucket, creating a durable and auditable data lake of all original documentation.

#### 3. Data Extraction

An AWS Lambda function triggers on new file uploads. It uses Optical Character Recognition (OCR) and intelligent parsing to extract key data points: vessel name, date, chemical levels (ROB), test results, and technician comments.

#### 4. Validation & Analysis

The structured data is fed into the core processing engine for validation. The engine calculates consumption rates, compares water quality against manufacturer limits, and computes Key Performance Indicators (KPIs).

#### 5. Insight Generation

Finally, the analyzed data powers interactive dashboards with rich graphical representations, triggers automated alerts for anomalies (e.g., low inventory, off-spec tests), and generates comprehensive reports for fleet managers and compliance teams. The alert system compares real-time data against the official **guidance values provided by suppliers like Drew Marine and WSS** to ensure strict adherence to their standards.

## Core Features

* **Real-time Inventory Monitoring**: Live tracking of all chemical levels.
* **Automated Consumption Analysis**: Identifies trends and flags deviations from norms.
* **Predictive ROB Calculations**: Forecasts remaining days of supply to prevent shortages.
* **Multi-supplier Integration**: Seamlessly handles data from Drew Marine, WSS, and others.
* **Interactive Data Visualization**: User-friendly dashboards with graphical representations of chemical trends, consumption rates, and compliance status.
* **Supplier-Specific Alerting**: Triggers alerts based on deviations from the official guidance values and operational limits provided by both Drew Marine and WSS.
* **Compliance Reporting**: Automated generation of reports for regulatory adherence.

## Technical Architecture

### Data Sources

The platform ingests data from three primary sources:

1. **Vessel Operations**: T-11 reports, consumption logs, and delivery notes.
2. **Supplier Networks**: Supply records and service reports from chemical suppliers.
3. **Document Storage**: All raw files (PDFs, spreadsheets) are stored and processed from AWS S3.

### Chemical Categories Monitored

* **Boiler Water (BWT)**: DREWPLEX AT, DREWPLEX OX, AMERZINE, AGK100, AUTOTREAT, OXYGENSCAVENGERPLUS.
* **Cooling Water (CWT)**: LIQUIDEWT, ROCOR NB.

## Quality Assurance & Data Integrity

* **Validation Rules**: The system sanitizes inputs, validates dates for temporal consistency, and standardizes chemical names and units across all sources.
* **Error Handling**: Gracefully manages missing data, uses fallback calculations, and provides clear alerts for data gaps to ensure reliability.

## Operational Benefits

* **For Fleet Managers**: Enables proactive maintenance, optimizes procurement costs, ensures compliance, and mitigates operational risks.
* **For Vessel Crew**: Provides immediate inventory status, helps optimize consumption, and centralizes all treatment records and documentation.

## System Integration & Infrastructure

* **Database**: Utilizes **MongoDB** for flexible, scalable data storage and high-performance queries.
* **Cloud Services**: Built on **AWS**, leveraging **S3** for storage, **Lambda** for serverless processing, and **API Gateway** for secure data access.

***