> ## Documentation Index
> Fetch the complete documentation index at: https://www.siya.com/llms.txt
> Use this file to discover all available pages before exploring further.
# Defects Tracking System
> Comprehensive maritime defect management platform processing vessel inspection data and generates structured responses to defect-related queries. The system handles different modules that cover various inspection and report types defect categories in maritime operations
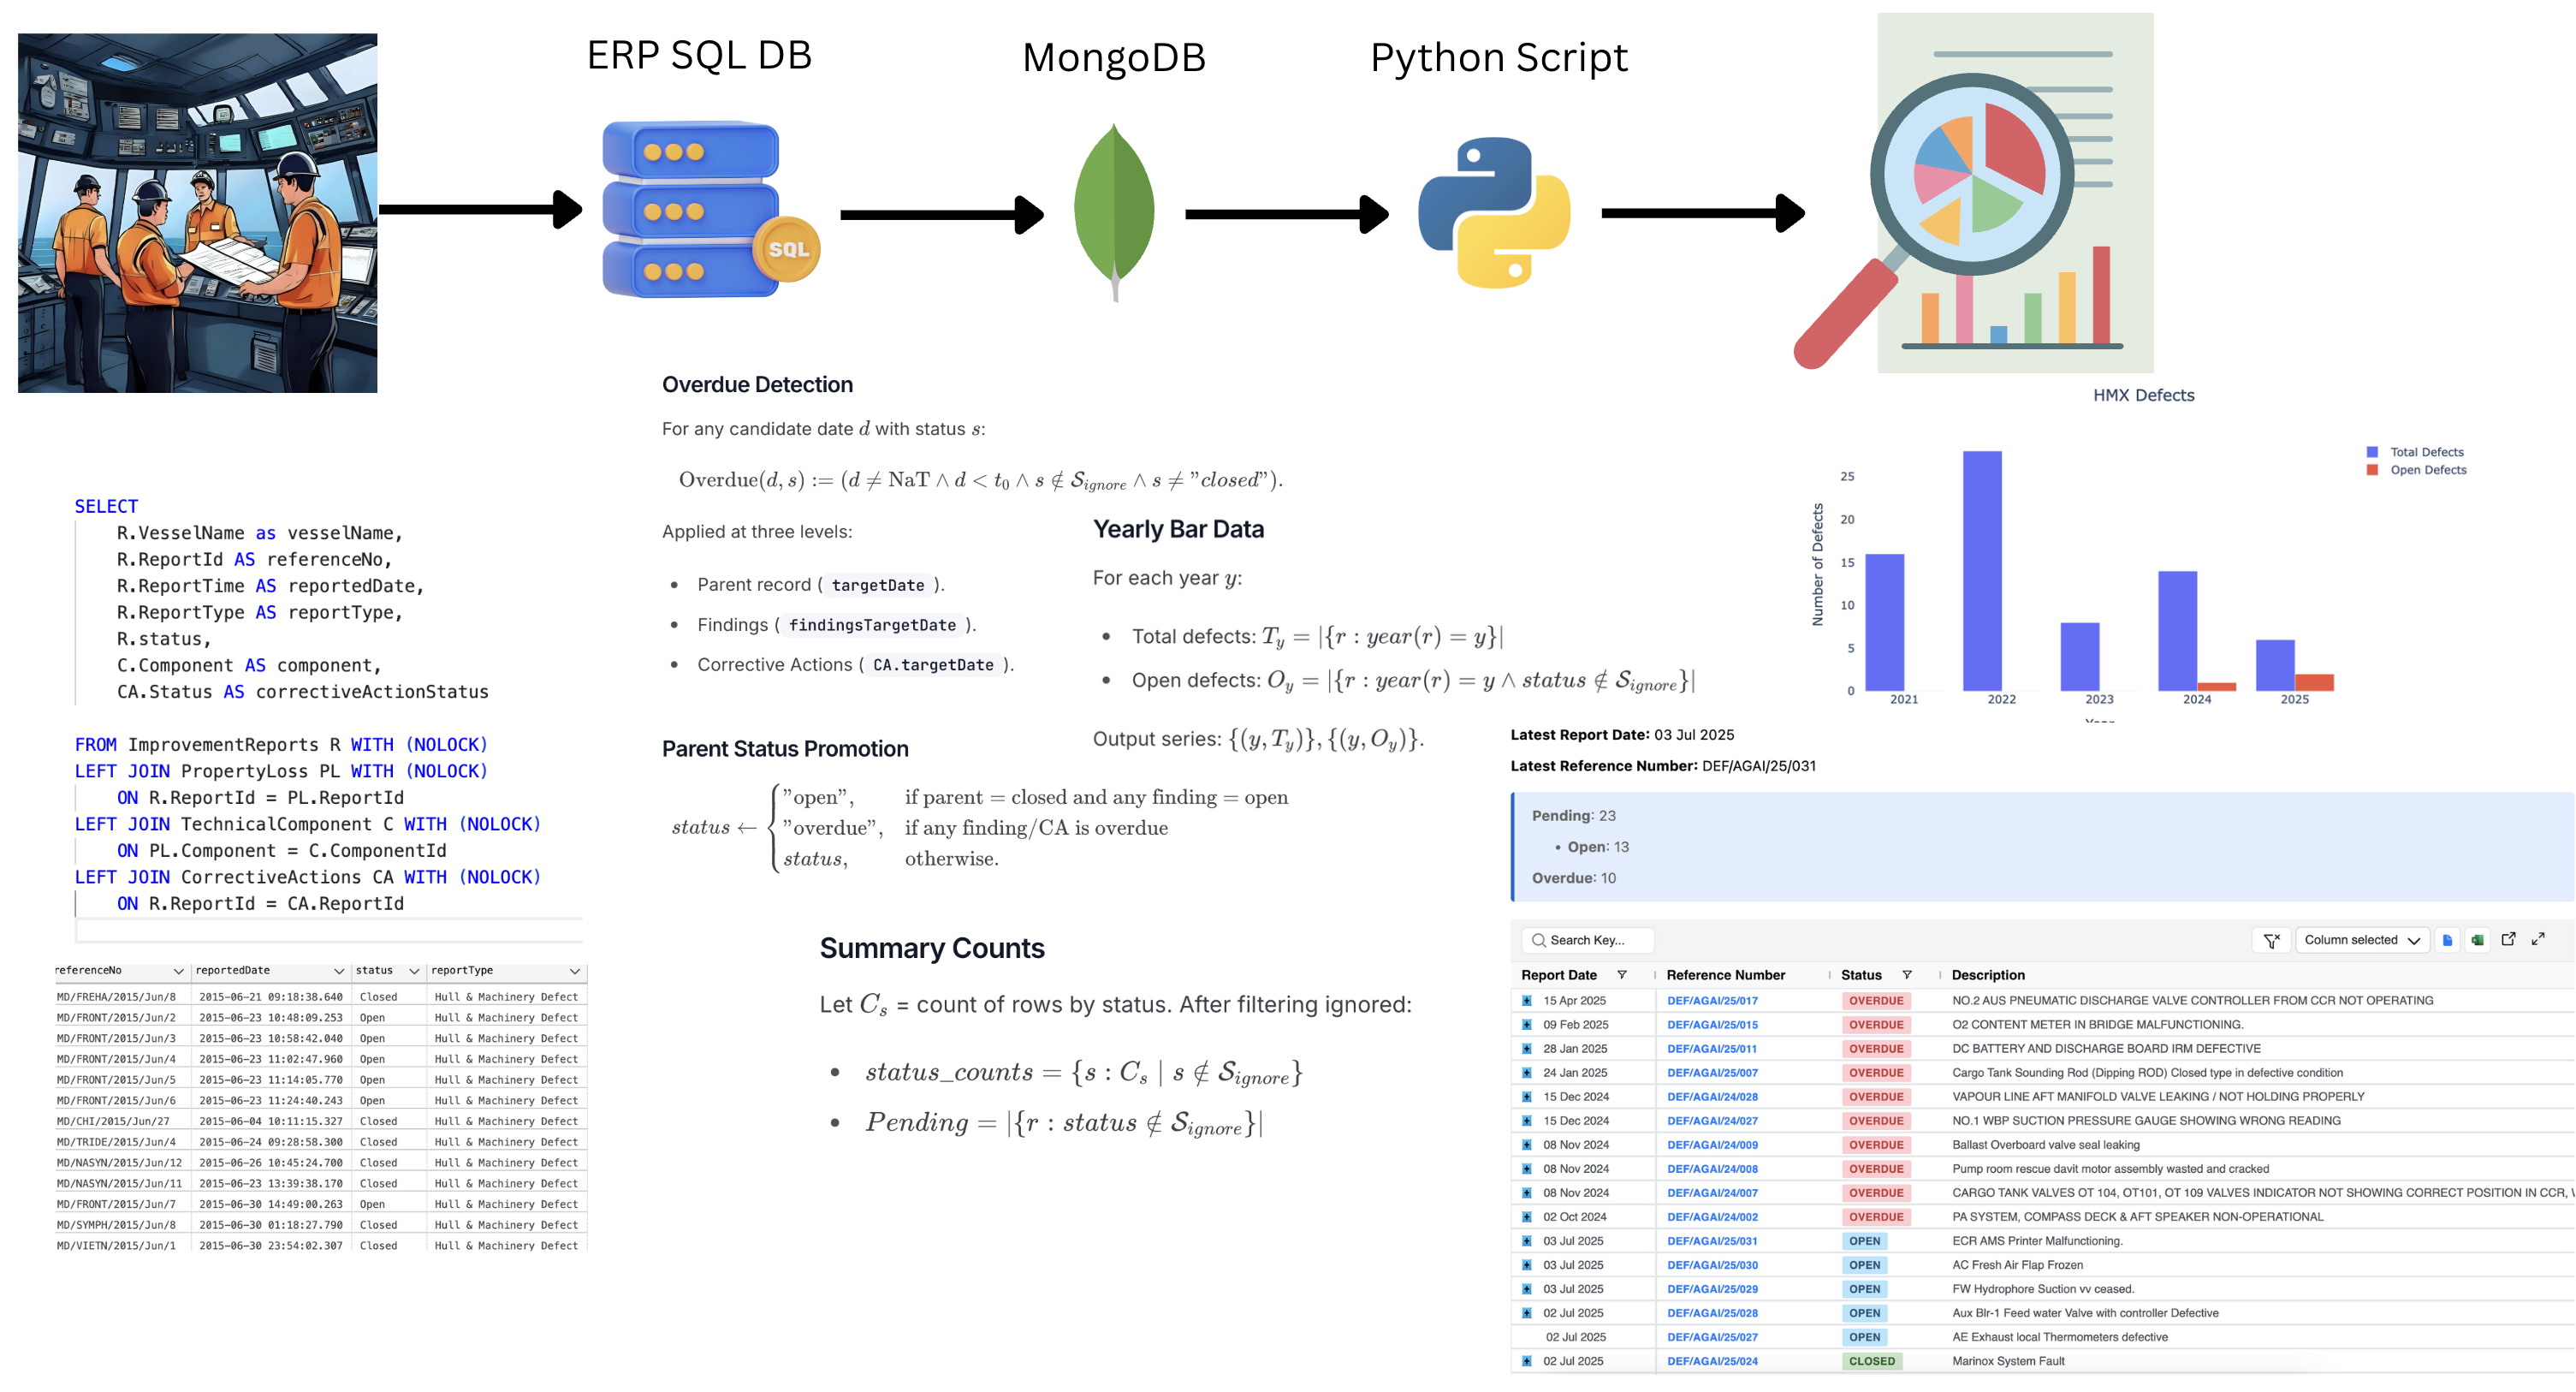 ## 🧭 System Architecture
```mermaid theme={null}
graph TB
subgraph DS ["Data Sources"]
direction TB
A1["ERP Source 1 System
## 🧭 System Architecture
```mermaid theme={null}
graph TB
subgraph DS ["Data Sources"]
direction TB
A1["ERP Source 1 System
Legacy SQL Database"]
A2["ERP Source 2 System
Enhanced SQL Database"]
end
subgraph MD ["MongoDB Storage"]
direction TB
M1["Source 1 Collections
Legacy Format"]
M2["Source 2 Collections
Enhanced Format"]
end
subgraph QM ["Defect Modules"]
direction TB
Q1["Inspection Defects
VIR, PSC, SIRE, CDI, Internal and External Audits, Terminal, Owner's, Charterer's Inspection"]
Q2["Report Defects
HMX, ADI, Nearmiss "]
Q3["Other Defects
Summary, CoC, Defects from excel"]
end
subgraph PE ["Processing Engine"]
direction TB
P1["Data Fetching
MongoDB Retrieval"]
P2["Data Processing
ETL Pipeline"]
P3["Status Processing
Overdue Detection"]
P4["Data Transformation
Format Standardization"]
end
subgraph OL ["Output Layer"]
direction TB
O1["Defect Module Outputs
Overdue and open defect counts with tables and charts"]
end
%% Data Flow Connections
A1 -->|"ERP Source 1 Data"| M1
A2 -->|"ERP Source 2 Data"| M2
M1 -->|"Source 1 Data"| P1
M2 -->|"Source 2 Data"| P1
P1 -->|"Raw Data"| P2
P2 -->|"Processed Data"| P3
P3 -->|"Status Data"| P4
P4 -->|"Standardized Data"| QM
QM -->|"Module Results"| O1
QM -->|"Module Results"| O1
QM -->|"Module Results"| O1
%% Styling with darker/bolder headings
classDef sourceNodes fill:#ffebee,stroke:#8e0000,stroke-width:4px,color:#000,font-weight:bold
classDef mongoNodes fill:#e1f5fe,stroke:#01579b,stroke-width:4px,color:#000,font-weight:bold
classDef moduleNodes fill:#e8f5e8,stroke:#1b5e20,stroke-width:4px,color:#000,font-weight:bold
classDef processNodes fill:#fff3e0,stroke:#e65100,stroke-width:4px,color:#000,font-weight:bold
classDef outputNodes fill:#f3e5f5,stroke:#4a148c,stroke-width:4px,color:#000,font-weight:bold
class A1,A2 sourceNodes
class M1,M2 mongoNodes
class Q1,Q2,Q3 moduleNodes
class P1,P2,P3,P4 processNodes
class O1 outputNodes
```
***
## 🗂️ Defect Module Categories
The SYIA Defect System handles different modules organized into three main categories:
```mermaid theme={null}
flowchart TD
subgraph MAIN ["SYIA Defect Modules"]
direction TB
subgraph INSP ["🔍 Inspection"]
direction TB
I1["VIR
"]
I1 --> I2["PSC
"]
I2 --> I3["SIRE
"]
I3 --> I4["CDI
"]
I4 --> I5["External Audit
"]
I5 --> I6["Internal Audit
"]
I6 --> I7["Terminal
"]
I7 --> I8["Charterer's Inspection"]
I8 --> I9["Owner's Inspections"]
I9 --> I10["SCMM"]
end
subgraph REP ["📝 Report"]
direction TB
R1["HMX
"]
R1 --> R2["ADI
"]
R2 --> R3["Near Miss
"]
end
subgraph OTHER ["📦 Other Defects"]
direction TB
O1["Summary
Defect Aggregation"]
O1 --> O2["CoC
Certificates"]
O2 --> O3["Excel
Integration"]
end
end
class MAIN mainBox
class INSP inspBox
class REP repBox
class OTHER otherBox
class I1,I2,I3,I4,I5,I6,I7,I8,I9,I10 inspNodes
class R1,R2,R3 repNodes
class O1,O2,O3 otherNodes
```
## 🗂️ Symbols & Sets
* $\mathcal{V}$ = set of active vessels, indexed by IMO number.
* $r$ = defect record.
* $y = \text{year}(\text{reportedDate})$ = reporting year.
* $t_0$ = current run date at midnight.
* $\mathcal{S}_{ignore} = \{\text{"closed"},\text{"inactive"},\text{"draft"},\text{"invalid"},\text{"rejected"},\text{"cancelled"}\}$ = ignored statuses.
## 🔄 Common Processing Logic
### 1. Data Retrieval & Cleaning
* Query MongoDB collections for inspection and report defects.
* Restrict to active vessels ($status = ACTIVE$).
* Normalize keys (case folding, unify field names).
* Parse dates: `reportedDate`, `targetDate`, `closingDate`, nested `findingsTargetDate`, `correctiveAction.targetDate`.
* Lowercase all statuses.
* Replace parse failures (`NaT`) with `None`.
* Standardize nested JSON structures (`findings`, `correctiveAction`).
### 2. Overdue Detection
For any candidate date $d$ with status $s$:
$$
\operatorname{Overdue}(d,s) := (d \neq \text{NaT} \land d < t_0 \land s \notin \mathcal{S}_{ignore} \land s \neq "closed").
$$
Applied at three levels:
* Parent record (`targetDate`).
* Findings (`findingsTargetDate`).
* Corrective Actions (`CA.targetDate`).
### 3. Parent Status Promotion
$$
status \gets
\begin{cases}
\text{"open"}, & \text{if parent = closed and any finding = open} \\
\text{"overdue"}, & \text{if any finding/CA is overdue} \\
status, & \text{otherwise}.
\end{cases}
$$
### 4. Status → Color Mapping
```python theme={null}
status_colors = {
"closed": "green",
"open": "blue",
"review in progress": "orange",
"overdue": "red",
"cancelled": "gray",
"inactive": "lightgray",
"rejected": "cyan"
# ... extended variants handled
}
```
***
## 📊 Aggregations
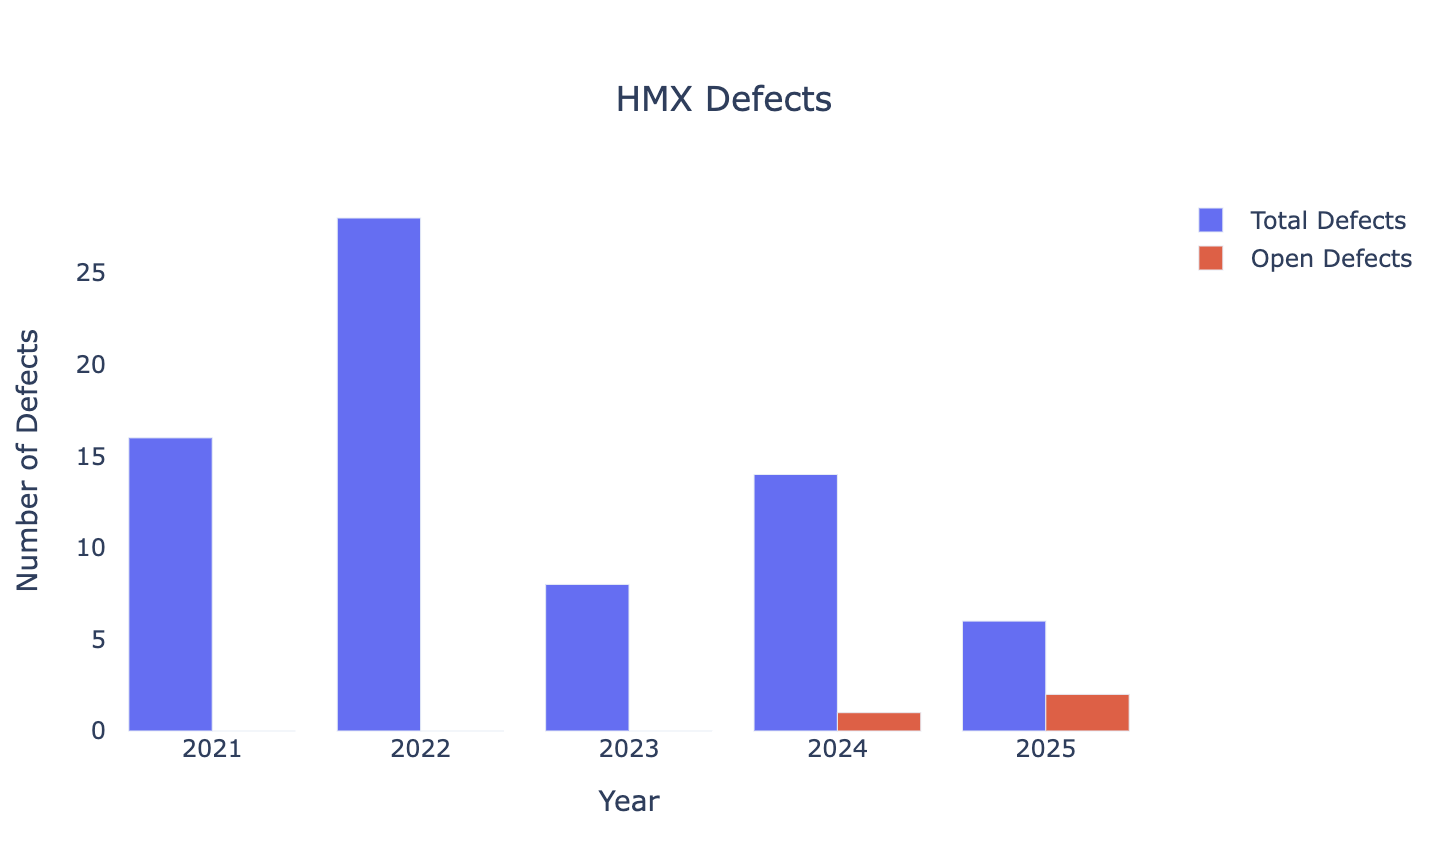
### Yearly Bar Data
For each year $y$:
* Total defects: $T_y = |\{ r : year(r)=y \}|$
* Open defects: $O_y = |\{ r : year(r)=y \land status \notin \mathcal{S}_{ignore} \}|$
Output series: $\{(y,T_y)\}, \{(y,O_y)\}$.
 ### Summary Counts
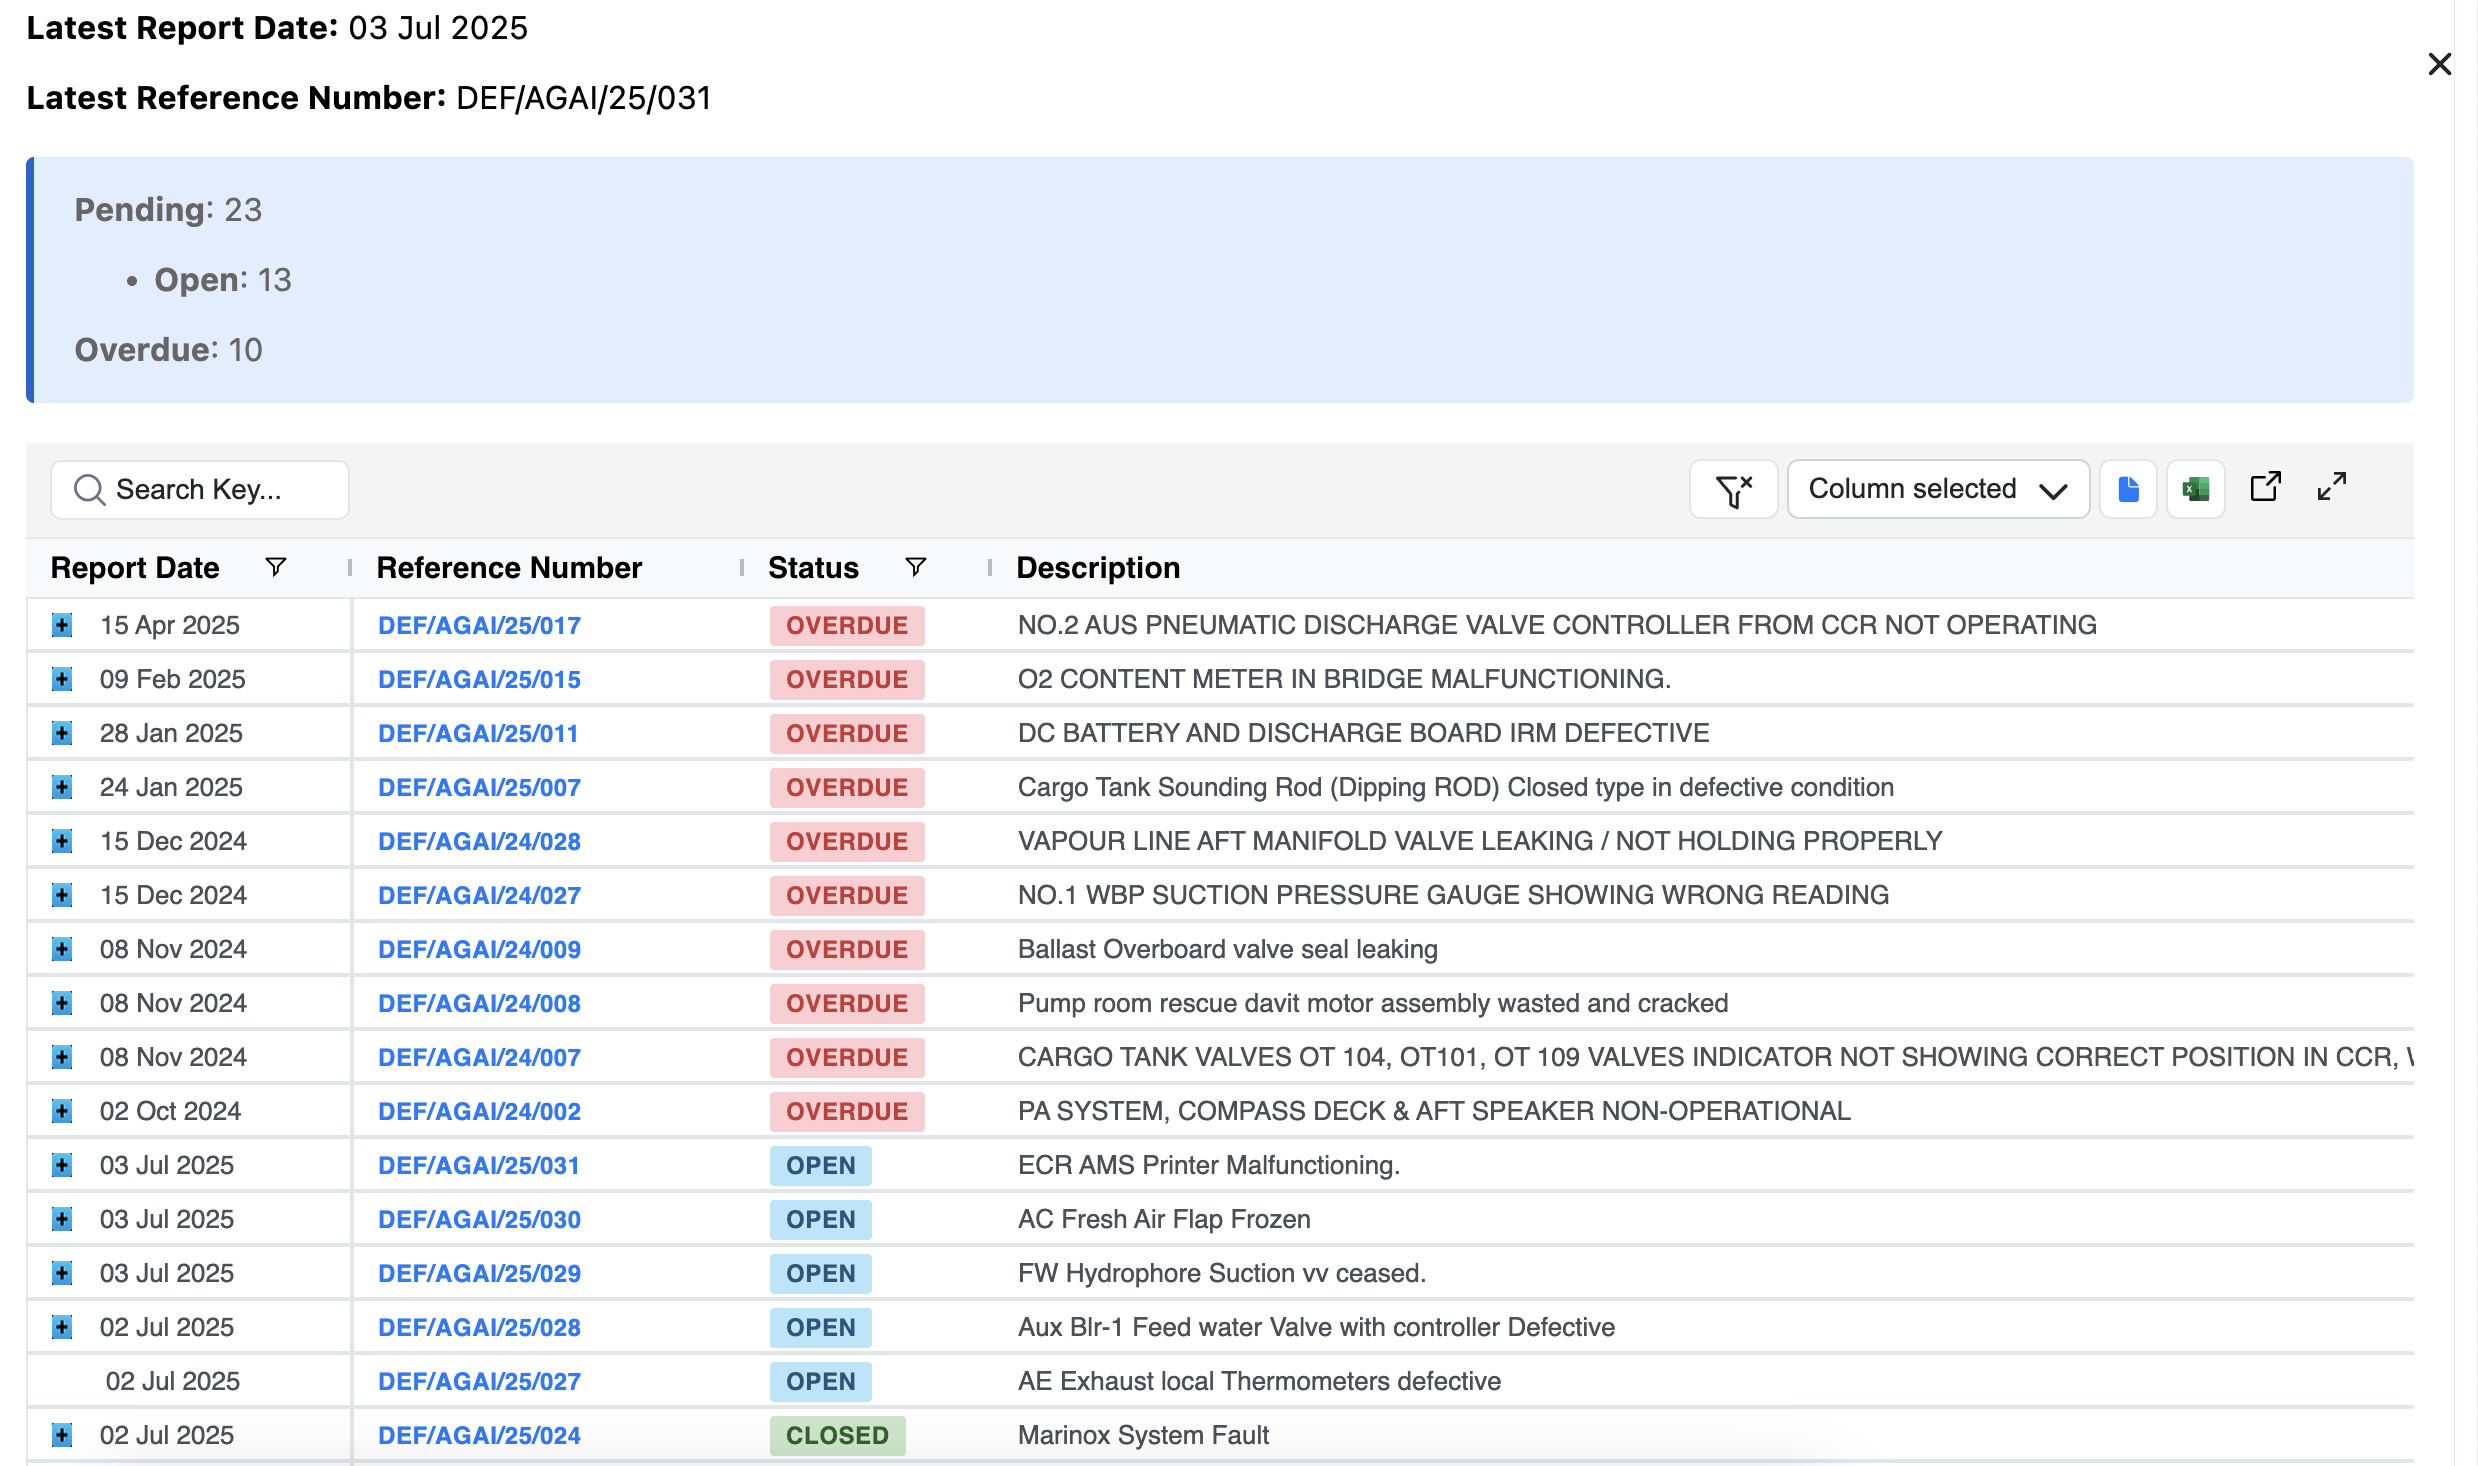
Let $C_s$ = count of rows by status. After filtering ignored:
* $status\_counts = \{ s : C_s \mid s \notin \mathcal{S}_{ignore} \}$
* $Pending = |\{ r : status \notin \mathcal{S}_{ignore} \}|$
### Summary Counts
Let $C_s$ = count of rows by status. After filtering ignored:
* $status\_counts = \{ s : C_s \mid s \notin \mathcal{S}_{ignore} \}$
* $Pending = |\{ r : status \notin \mathcal{S}_{ignore} \}|$
 ***
## 🧮 Common Output Structures
* **Tabular rows**: `[Report Date, Reference No (link), Status, Description, Target Date, Closing Date, Closing Note, Source]`
* **Charts**: Yearly bar plots (Total vs Open).
* **Summary JSON**: status counts, pending counts, chart data.
* **Lineitems**: nested findings + corrective actions with overdue annotations.
***
## ⚙️ Algorithm
1. Load environment + set $t_0$.
2. Fetch active vessels.
3. Retrieve raw defect data (inspection/report collections).
4. Normalize fields, lowercase status, parse datetimes.
5. Build findings + corrective actions arrays.
6. Apply overdue detection + parent status promotion.
7. Aggregate yearly bars and status counts.
8. Format outputs (tables, charts, summaries).
9. Assign colors with `status_colors`.
10. Upsert into MongoDB component collections.
***
## ✅ Robust Engineering
* **Idempotent upserts** (`update_one(..., upsert=True)`).
* **Consistent normalization**: statuses always lowercase, dates coerced.
* **Error handling**: try/except per vessel; log errors without halting pipeline.
* **Deterministic sort order**: `(reportedDate desc, status_color, targetDate, referenceNo)`.
* **Test mode override** for fixed $t_0$ values.
***
## 📊 Worked Example
Suppose a record has:
* Parent status = `open`, `targetDate=None`.
* One finding with `findingStatus=open`, `findingsTargetDate=t_0-1 day`.
Then:
* $Overdue(findingsTargetDate,open) = True$
* Finding → `overdue`.
* Parent → `overdue`.
* Assigned color = red.
***
***
## 🧮 Common Output Structures
* **Tabular rows**: `[Report Date, Reference No (link), Status, Description, Target Date, Closing Date, Closing Note, Source]`
* **Charts**: Yearly bar plots (Total vs Open).
* **Summary JSON**: status counts, pending counts, chart data.
* **Lineitems**: nested findings + corrective actions with overdue annotations.
***
## ⚙️ Algorithm
1. Load environment + set $t_0$.
2. Fetch active vessels.
3. Retrieve raw defect data (inspection/report collections).
4. Normalize fields, lowercase status, parse datetimes.
5. Build findings + corrective actions arrays.
6. Apply overdue detection + parent status promotion.
7. Aggregate yearly bars and status counts.
8. Format outputs (tables, charts, summaries).
9. Assign colors with `status_colors`.
10. Upsert into MongoDB component collections.
***
## ✅ Robust Engineering
* **Idempotent upserts** (`update_one(..., upsert=True)`).
* **Consistent normalization**: statuses always lowercase, dates coerced.
* **Error handling**: try/except per vessel; log errors without halting pipeline.
* **Deterministic sort order**: `(reportedDate desc, status_color, targetDate, referenceNo)`.
* **Test mode override** for fixed $t_0$ values.
***
## 📊 Worked Example
Suppose a record has:
* Parent status = `open`, `targetDate=None`.
* One finding with `findingStatus=open`, `findingsTargetDate=t_0-1 day`.
Then:
* $Overdue(findingsTargetDate,open) = True$
* Finding → `overdue`.
* Parent → `overdue`.
* Assigned color = red.
***