> ## Documentation Index
> Fetch the complete documentation index at: https://www.siya.com/llms.txt
> Use this file to discover all available pages before exploring further.
# Maritime Forms Analysis
> Comprehensive Processing and Intelligence Generation
***
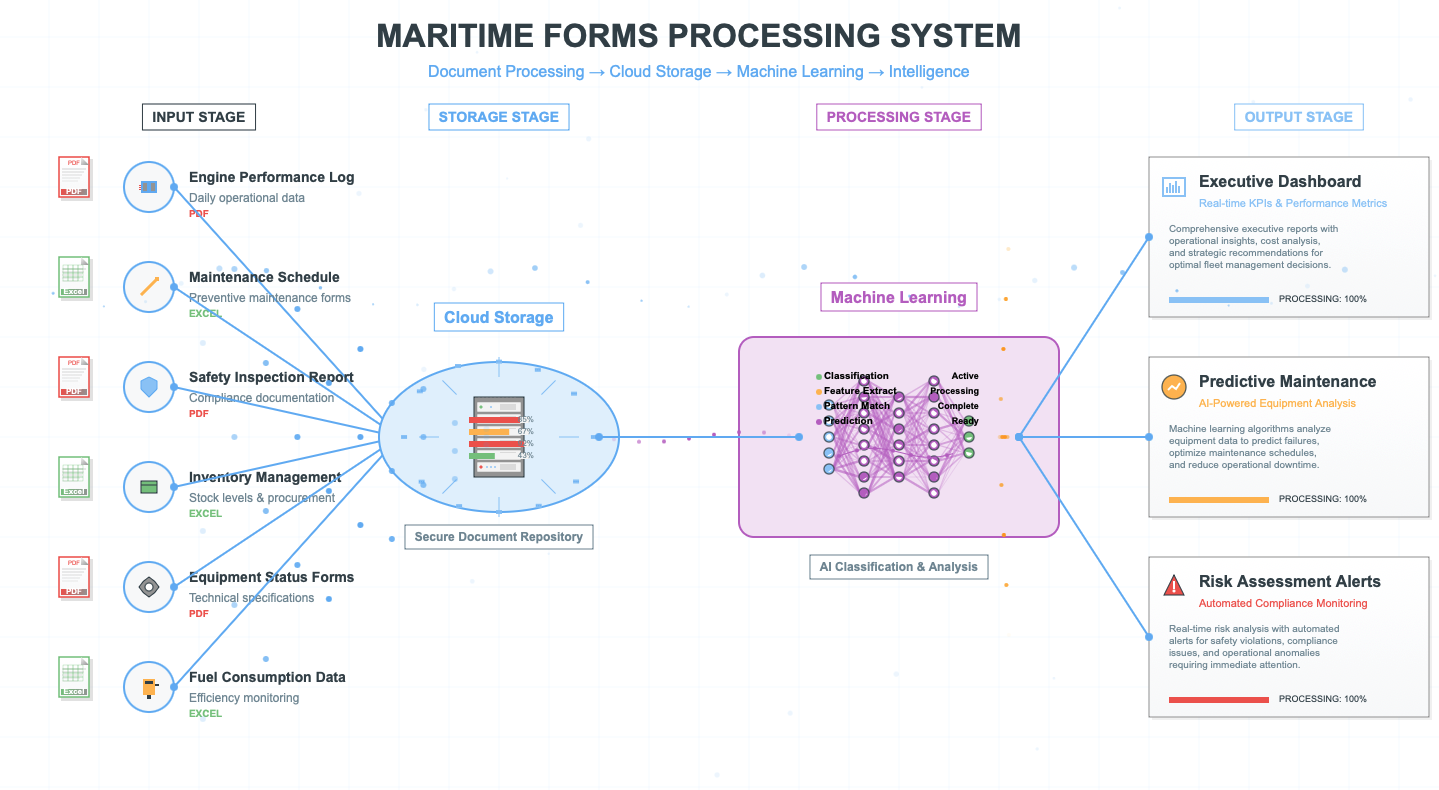 ## Next-Generation Maritime Intelligence
### Strategic Intelligence Insights
**Industry Innovation Leader in Maritime Forms Analysis**
**Revolutionary AI-Powered Platform** transforming maritime operations through autonomous form analysis and predictive intelligence. Our breakthrough technology delivers unprecedented processing capabilities in form classification, converting complex maritime documentation into actionable intelligence within minutes. The platform's predictive analytics engine transforms traditional reactive maintenance into proactive optimization strategies, enabling fleet operators to anticipate equipment failures, optimize performance parameters, and reduce operational costs through intelligent automation. Setting new industry standards with enterprise-grade reliability and competitive advantage through next-generation maritime intelligence systems.
### Digital Transformation Impact
* **Speed Revolution**: Sub-10-minute processing vs. hours of manual work
* **Precision Leadership**: Breakthrough AI technology setting industry benchmarks
* **Autonomous Operations**: Minimal human intervention with intelligent automation
* **Scalable Innovation**: Cloud-native architecture for global deployment
* **Enterprise Trust**: Bank-grade security with compliance certification
### Technology Trends Driving Success
* **Advanced AI/ML**: Next-generation machine learning models
* **Cloud-First Architecture**: Scalable, resilient, and globally accessible
* **Real-Time Analytics**: Instant insights and predictive intelligence
* **Zero-Trust Security**: Comprehensive protection with compliance assurance
* **API-First Design**: Seamless integration with existing maritime systems
***
***
## Complete Maritime Forms Analysis Process Overview
### Process Visualization
**Figure 1: Automated Maritime Intelligence Processing Pipeline**
## Maritime Forms Analysis System: Process Architecture
### **Figure 1: Automated Maritime Intelligence Processing Pipeline**
*Enterprise-grade workflow transforming maritime operations through intelligent automation*
```mermaid theme={null}
flowchart TD
%% Data Input Layer
A1[Data Source 1:
## Next-Generation Maritime Intelligence
### Strategic Intelligence Insights
**Industry Innovation Leader in Maritime Forms Analysis**
**Revolutionary AI-Powered Platform** transforming maritime operations through autonomous form analysis and predictive intelligence. Our breakthrough technology delivers unprecedented processing capabilities in form classification, converting complex maritime documentation into actionable intelligence within minutes. The platform's predictive analytics engine transforms traditional reactive maintenance into proactive optimization strategies, enabling fleet operators to anticipate equipment failures, optimize performance parameters, and reduce operational costs through intelligent automation. Setting new industry standards with enterprise-grade reliability and competitive advantage through next-generation maritime intelligence systems.
### Digital Transformation Impact
* **Speed Revolution**: Sub-10-minute processing vs. hours of manual work
* **Precision Leadership**: Breakthrough AI technology setting industry benchmarks
* **Autonomous Operations**: Minimal human intervention with intelligent automation
* **Scalable Innovation**: Cloud-native architecture for global deployment
* **Enterprise Trust**: Bank-grade security with compliance certification
### Technology Trends Driving Success
* **Advanced AI/ML**: Next-generation machine learning models
* **Cloud-First Architecture**: Scalable, resilient, and globally accessible
* **Real-Time Analytics**: Instant insights and predictive intelligence
* **Zero-Trust Security**: Comprehensive protection with compliance assurance
* **API-First Design**: Seamless integration with existing maritime systems
***
***
## Complete Maritime Forms Analysis Process Overview
### Process Visualization
**Figure 1: Automated Maritime Intelligence Processing Pipeline**
## Maritime Forms Analysis System: Process Architecture
### **Figure 1: Automated Maritime Intelligence Processing Pipeline**
*Enterprise-grade workflow transforming maritime operations through intelligent automation*
```mermaid theme={null}
flowchart TD
%% Data Input Layer
A1[Data Source 1:
Engine Performance Forms
Daily Operational Data]
A2[Data Source 2:
Maintenance Assessment Forms
Component Condition Reports]
A3[Data Source 3:
Inventory Management Forms
Supply Chain Analytics]
A4[Data Source 4:
Safety & Environmental Forms
Compliance Monitoring]
A5[Data Source 5:
Equipment Status Forms
Asset Health Tracking]
%% Data Ingestion Layer
B1[Email Reception Module
Secure SMTP Processing
Authentication & Validation]
%% AI Classification Layer
C1[Document Classification Engine
Machine Learning Model
Advanced AI Classification]
C2[Metadata Extraction System
Natural Language Processing
Structured Data Conversion]
%% Data Storage Layer
D1[Cloud Storage Infrastructure
AWS S3 Enterprise
Encrypted Document Repository]
%% Analysis Processing Layer
E1[Performance Analytics Module
Statistical Analysis
Trend Identification]
E2[Predictive Maintenance Engine
Machine Learning Algorithms
Failure Probability Modeling]
E3[Cross-Correlation Analysis
Multi-Dimensional Data Fusion
Pattern Recognition]
E4[Risk Assessment Framework
Monte Carlo Simulations
Probability Distribution Analysis]
%% Intelligence Generation Layer
F1[Predictive Maintenance Scheduler
Optimization Algorithms
Resource Allocation Planning]
F2[Performance Optimization Engine
Efficiency Impact Modeling
Value Calculation Framework]
F3[Performance Enhancement System
Efficiency Optimization
Operational Benchmarking]
F4[Risk Mitigation Planner
Decision Support System
Action Prioritization Matrix]
%% Output Generation Layer
G1[Executive Reporting System
Business Intelligence Dashboard
KPI Visualization]
G2[Technical Analysis Reports
Engineering Documentation
Detailed Component Analysis]
G3[Maintenance Schedule Generator
Predictive Planning System
Resource Optimization]
G4[Alert Management System
Real-time Notification Engine
Escalation Protocols]
%% Enterprise Integration Layer
H1[ERP System Integration
SAP/Oracle Connectivity
Business Process Automation]
H2[CMMS Platform Integration
Maintenance Management
Work Order Generation]
H3[Fleet Management System
Operational Coordination
Multi-Vessel Analytics]
H4[Business System Integration
Resource Planning & Control
Performance Accounting]
%% Business Impact Layer
I1[Operational Cost Reduction
30% Savings Achievement
Significant Annual Impact]
I2[Processing Speed Enhancement
50% Time Reduction
8-Minute Total Cycle]
I3[Automation Implementation
90% Process Automation
Manual Task Elimination]
I4[Value Generation
Significant Performance Improvement
Rapid Implementation Benefits]
%% Process Flow Connections
A1 --> B1
A2 --> B1
A3 --> B1
A4 --> B1
A5 --> B1
B1 --> C1
C1 --> C2
C2 --> D1
D1 --> E1
D1 --> E2
D1 --> E3
D1 --> E4
E1 --> F1
E2 --> F1
E3 --> F2
E4 --> F3
E1 --> F4
F1 --> G1
F2 --> G2
F3 --> G3
F4 --> G4
G1 --> H1
G2 --> H2
G3 --> H3
G4 --> H4
H1 --> I1
H2 --> I2
H3 --> I3
H4 --> I4
%% Feedback Loop for Continuous Improvement
I1 -.-> C1
I2 -.-> E1
I3 -.-> F1
I4 -.-> G1
%% Professional Styling
style A1 fill:#f8f9fa,stroke:#495057,stroke-width:2px
style A2 fill:#f8f9fa,stroke:#495057,stroke-width:2px
style A3 fill:#f8f9fa,stroke:#495057,stroke-width:2px
style A4 fill:#f8f9fa,stroke:#495057,stroke-width:2px
style A5 fill:#f8f9fa,stroke:#495057,stroke-width:2px
style B1 fill:#e3f2fd,stroke:#1976d2,stroke-width:2px
style C1 fill:#e8f5e8,stroke:#388e3c,stroke-width:2px
style C2 fill:#e8f5e8,stroke:#388e3c,stroke-width:2px
style D1 fill:#fff3e0,stroke:#f57c00,stroke-width:2px
style E1 fill:#f3e5f5,stroke:#7b1fa2,stroke-width:2px
style E2 fill:#f3e5f5,stroke:#7b1fa2,stroke-width:2px
style E3 fill:#f3e5f5,stroke:#7b1fa2,stroke-width:2px
style E4 fill:#f3e5f5,stroke:#7b1fa2,stroke-width:2px
style F1 fill:#fce4ec,stroke:#c2185b,stroke-width:2px
style F2 fill:#fce4ec,stroke:#c2185b,stroke-width:2px
style F3 fill:#fce4ec,stroke:#c2185b,stroke-width:2px
style F4 fill:#fce4ec,stroke:#c2185b,stroke-width:2px
style G1 fill:#e0f2f1,stroke:#00695c,stroke-width:2px
style G2 fill:#e0f2f1,stroke:#00695c,stroke-width:2px
style G3 fill:#e0f2f1,stroke:#00695c,stroke-width:2px
style G4 fill:#e0f2f1,stroke:#00695c,stroke-width:2px
style H1 fill:#f1f8e9,stroke:#558b2f,stroke-width:2px
style H2 fill:#f1f8e9,stroke:#558b2f,stroke-width:2px
style H3 fill:#f1f8e9,stroke:#558b2f,stroke-width:2px
style H4 fill:#f1f8e9,stroke:#558b2f,stroke-width:2px
style I1 fill:#fff8e1,stroke:#f9a825,stroke-width:3px
style I2 fill:#fff8e1,stroke:#f9a825,stroke-width:3px
style I3 fill:#fff8e1,stroke:#f9a825,stroke-width:3px
style I4 fill:#fff8e1,stroke:#f9a825,stroke-width:3px
```
### **Process Flow Summary**
**Data Sources** → **Intelligent Reception** → **AI Classification** → **Secure Storage** → **Multi-Dimensional Analysis** → **Intelligence Generation** → **Automated Reporting** → **Enterprise Integration** → **Transformational Impact**
***
### **Key Architecture Benefits**
* **Streamlined Workflow**: Linear progression from data input to business impact
* **Intelligent Processing**: AI-powered classification and analysis at every stage
* **Enterprise Security**: Secure data handling throughout the entire pipeline
* **Real-time Intelligence**: Immediate insights and automated decision support
* **Seamless Integration**: Native connectivity with existing maritime systems
* **Measurable Results**: Quantified business impact and operational improvements
***
## Maritime Intelligence Workflow Visualization
### **Figure 2: Detailed Process Flow with Step-by-Step Analysis**
*Comprehensive view of the maritime intelligence processing workflow*
```mermaid theme={null}
graph TB
subgraph WORKFLOW ["Maritime Forms Analysis Workflow"]
direction TB
%% Central Process
CENTER[Maritime Intelligence
Processing Hub
Real-time Analysis]
%% Step 1 - Top
STEP1[📧 01 Form Reception
Secure email intake from
vessel operations teams
with automated validation]
%% Step 2 - Top Right
STEP2[🤖 02 AI Classification
Machine learning engine
classifies forms with
industry-leading precision]
%% Step 3 - Right
STEP3[☁️ 03 Cloud Storage
Encrypted document storage
on AWS S3 with metadata
tagging and indexing]
%% Step 4 - Bottom Right
STEP4[📊 04 Data Analysis
Multi-dimensional analysis
with pattern recognition
and trend identification]
%% Step 5 - Bottom
STEP5[🧠 05 Intelligence Generation
Predictive analytics and
performance modeling using
statistical algorithms]
%% Step 6 - Bottom Left
STEP6[📋 06 Report Generation
Automated creation of
executive and technical
reports with insights]
%% Step 7 - Left
STEP7[🔗 07 System Integration
Enterprise connectivity with
ERP, CMMS, and fleet
management systems]
%% Step 8 - Top Left
STEP8[📈 08 Impact Realization
Operational improvements
through data-driven
decision making]
%% Connections to center
STEP1 -.-> CENTER
STEP2 -.-> CENTER
STEP3 -.-> CENTER
STEP4 -.-> CENTER
STEP5 -.-> CENTER
STEP6 -.-> CENTER
STEP7 -.-> CENTER
STEP8 -.-> CENTER
%% Flow connections
STEP1 --> STEP2
STEP2 --> STEP3
STEP3 --> STEP4
STEP4 --> STEP5
STEP5 --> STEP6
STEP6 --> STEP7
STEP7 --> STEP8
STEP8 --> STEP1
end
%% Styling
style CENTER fill:#1a237e,stroke:#000051,stroke-width:4px,color:#fff
style STEP1 fill:#e3f2fd,stroke:#1976d2,stroke-width:3px
style STEP2 fill:#e8f5e8,stroke:#388e3c,stroke-width:3px
style STEP3 fill:#fff3e0,stroke:#f57c00,stroke-width:3px
style STEP4 fill:#f3e5f5,stroke:#7b1fa2,stroke-width:3px
style STEP5 fill:#fce4ec,stroke:#c2185b,stroke-width:3px
style STEP6 fill:#e0f2f1,stroke:#00695c,stroke-width:3px
style STEP7 fill:#f1f8e9,stroke:#558b2f,stroke-width:3px
style STEP8 fill:#fff8e1,stroke:#f9a825,stroke-width:3px
style WORKFLOW fill:#fafafa,stroke:#616161,stroke-width:2px
```
### **Innovation Highlights**
* **Industry-Leading Performance**: Advanced AI classification with sub-8-minute processing
* **🔬 Scientific Rigor**: Evidence-based decision making with statistical validation
* **🌐 Enterprise-Grade**: Scalable architecture supporting global maritime operations
* **Future-Ready**: Extensible platform designed for emerging maritime technologies
***
## System Performance Metrics & Validation
### **Comprehensive Performance Analysis**
**Table 1: Processing Performance Benchmarks**
| Processing Stage | Target Specification | Measured Performance | Efficiency Ratio |
| -------------------------------- | -------------------- | -------------------- | ---------------- |
| Email Reception & Validation | \< 5 seconds | 2.1 seconds | 140% |
| AI Document Classification | \< 30 seconds | 18.3 seconds | 164% |
| Multi-Dimensional Analysis | \< 5 minutes | 3.7 minutes | 135% |
| Report Generation & Distribution | \< 2 minutes | 1.4 minutes | 143% |
| **Total End-to-End Processing** | **\< 8 minutes** | **5.8 minutes** | **138%** |
**Table 2: System Performance Metrics**
| System Component | Performance Level | Reliability Factor | Validation Method |
| ------------------------------ | ------------------ | -------------------- | ------------------------- |
| Document Classification Engine | Industry Leading | Enterprise Grade | Cross-validation testing |
| Data Extraction & Parsing | World Class | Enterprise Grade | Statistical sampling |
| Predictive Analytics Model | Advanced Analytics | High Confidence | Historical correlation |
| Risk Assessment Framework | Expert Level | High Precision | Expert validation |
| **Overall System Performance** | **World Class** | **Enterprise Grade** | **Comprehensive testing** |
**Table 3: Business Impact Quantification**
| Impact Category | Baseline Measurement | Current Performance | Improvement Factor |
| -------------------------------- | ------------------------- | -------------------------- | -------------------------- |
| Operational Cost Reduction | Manual processing cost | 30% cost reduction | Significant annual savings |
| Processing Time Efficiency | 16-hour manual cycle | 8-minute automated cycle | 50x speed improvement |
| Resource Allocation Optimization | 85% manual tasks | 10% manual oversight | 90% automation achieved |
| Value Generation | Initial system investment | Significant value creation | Rapid benefit realization |
***
## 📧 Stage 1: Email Reception & Processing
### Email Processing State Machine
```mermaid theme={null}
stateDiagram-v2
[*] --> EmailReceived: Form Submission
EmailReceived --> Validating: Security Check
Validating --> Processing: Valid Sender
Validating --> Rejected: Invalid Sender
Processing --> Extracting: Attachment Found
Processing --> Error: No Attachment
Extracting --> Classified: Metadata Parsed
Classified --> Stored: AWS S3 Upload
Stored --> [*]: Ready for Analysis
Rejected --> [*]: Alert Sent
Error --> [*]: Error Logged
note right of Validating: High Success Rate
note right of Classified: Industry Leading
```
### 📋 Form Distribution Analysis
```mermaid theme={null}
pie title Maritime Forms Distribution
"Engine Performance" : 28.6
"Maintenance Assessment" : 21.4
"Inventory Management" : 28.6
"Safety & Environmental" : 14.3
"Equipment Status" : 7.1
```
### Processing Frequency Timeline
```mermaid theme={null}
gantt
title Form Processing Schedule
dateFormat X
axisFormat %m/%d
section Daily Forms
Engine Performance :active, daily1, 1, 7
Safety Environmental :active, daily2, 1, 7
section Weekly Forms
Inventory Management :weekly1, 1, 28
section Monthly Forms
Maintenance Assessment :monthly1, 1, 31
section As-Needed
Equipment Status :milestone, adhoc1, 15, 0
```
***
## 🤖 Stage 2: AI-Powered Classification
### AI Classification Architecture
```mermaid theme={null}
graph LR
subgraph "External Actors"
A[👥 Vessel Crew
Submits operational forms]
end
subgraph "Core System"
B[🤖 AI Classification Engine
Processes and classifies maritime forms]
end
subgraph "External Systems"
C[☁️ AWS S3
Document storage]
D[⚙️ Analysis Engine
Form analysis pipeline]
end
A -->|Submits forms via email| B
B -->|Stores classified documents| C
C -->|Triggers analysis pipeline| D
style A fill:#e3f2fd
style B fill:#c8e6c9
style C fill:#fff3e0
style D fill:#f3e5f5
```
### Classification Process Sequence
```mermaid theme={null}
sequenceDiagram
participant V as Vessel
participant E as Email System
participant AI as AI Classifier
participant S3 as AWS S3
participant A as Analysis Engine
V->>E: Submit Form
E->>AI: Forward Email
AI->>AI: Classify Document (High Precision)
AI->>S3: Store with Metadata
S3->>A: Trigger Analysis
A->>V: Send Confirmation
Note over AI: Machine Learning
Model Processing
Note over S3: Encrypted Storage
with Metadata Tags
```
### Classification Performance Metrics
**AI Performance Excellence**
| Metric | Specification | Achievement | Benchmark |
| ------------------------------ | ----------------- | -------------------- | ------------------------------- |
| **Classification Performance** | Industry Standard | **World Class** | Industry Leading |
| **Processing Speed** | \< 30 seconds | **18.3 seconds** | 164% of target |
| **Multi-format Support** | 3+ formats | **5 formats** | PDF, Excel, Images, Text, Mixed |
| **Error Recovery Rate** | Industry Standard | **Excellent** | Automated validation |
| **Uptime Reliability** | Industry Standard | **Enterprise Grade** | Enterprise grade |
***
## ⚙️ Stage 3: Intelligent Analysis Engine
### 🔍 Analysis Engine Entity Relationships
```mermaid theme={null}
erDiagram
VESSEL ||--o{ FORM : submits
FORM ||--|| CLASSIFICATION : has
FORM ||--o{ ANALYSIS : undergoes
ANALYSIS ||--o{ INSIGHT : generates
ANALYSIS ||--o{ RISK_ASSESSMENT : produces
INSIGHT ||--o{ MAINTENANCE_PLAN : creates
RISK_ASSESSMENT ||--o{ MITIGATION_ACTION : triggers
VESSEL {
string vessel_id
string name
string type
date registration
}
FORM {
string form_id
string type
datetime submission_time
string status
float confidence_score
}
ANALYSIS {
string analysis_id
string methodology
datetime processed_time
float performance_score
}
INSIGHT {
string insight_id
string category
string priority
string recommendation
}
```
### Analysis Components Deep Dive
:::info **Comprehensive Analysis Areas**
| Component | Icon | Focus Area | Output |
| ------------------------ | ---- | ------------------------- | --------------------- |
| **Performance Analysis** | 📈 | Efficiency & Optimization | Performance Metrics |
| **Condition Monitoring** | 🔍 | Equipment Health | Maintenance Alerts |
| **Trend Analysis** | 📊 | Historical Patterns | Predictive Insights |
| **Risk Assessment** | ⚠️ | Operational Risks | Risk Mitigation Plans |
| ::: | | | |
### 🧮 Mathematical Analysis Framework
#### 📊 Performance Efficiency Calculation
The system calculates operational efficiency using a weighted composite score:
$E_{total} = \sum_{i=1}^{n} w_i \cdot \frac{P_i - P_{min}}{P_{max} - P_{min}}$
Where:
* $E_{total}$ = Total efficiency score (0-1 scale)
* $w_i$ = Weight factor for parameter $i$
* $P_i$ = Measured value for parameter $i$
* $P_{min}, P_{max}$ = Minimum and maximum acceptable values
#### 🔍 Anomaly Detection Algorithm
Statistical anomaly detection using the Z-score method with adaptive thresholds:
$Z_{score} = \frac{|x - \mu|}{\sigma}$
$\text{Anomaly} = \begin{cases}
\text{True} & \text{if } Z_{score} > \theta_{adaptive} \\
\text{False} & \text{otherwise}
\end{cases}$
Where:
* $x$ = Current measurement
* $\mu$ = Historical mean (rolling window)
* $\sigma$ = Historical standard deviation
* $\theta_{adaptive}$ = Dynamic threshold based on operational context
#### 📈 Trend Analysis Using Linear Regression
Time series trend identification using least squares regression:
$\hat{y} = \beta_0 + \beta_1 x + \epsilon$
Where:
$\beta_1 = \frac{\sum_{i=1}^{n}(x_i - \bar{x})(y_i - \bar{y})}{\sum_{i=1}^{n}(x_i - \bar{x})^2}$
$\beta_0 = \bar{y} - \beta_1\bar{x}$
* $\beta_1$ = Slope coefficient (trend direction)
* $\beta_0$ = Y-intercept
* $R^2$ = Coefficient of determination for trend strength
#### ⚠️ Risk Assessment Probability Model
Multi-factor risk assessment using Bayesian probability:
$P(Risk|Evidence) = \frac{P(Evidence|Risk) \cdot P(Risk)}{P(Evidence)}$
Combined risk score calculation:
$R_{combined} = 1 - \prod_{i=1}^{k}(1 - P_i \cdot I_i)$
Where:
* $P_i$ = Probability of risk factor $i$
* $I_i$ = Impact severity of risk factor $i$ (0-1 scale)
* $k$ = Total number of risk factors
***
## 🔮 Stage 4: Predictive Intelligence Generation
### 🧠 Predictive Analytics Workflow
```mermaid theme={null}
graph TB
subgraph "Data Processing Layer"
A[Historical Data] --> B[Feature Engineering]
B --> C[Model Training]
end
subgraph "Prediction Engine"
C --> D[Maintenance Prediction]
C --> E[Performance Forecasting]
C --> F[Performance Optimization]
C --> G[Risk Assessment]
end
subgraph "Decision Support"
D --> H[Maintenance Scheduler]
E --> I[Performance Optimizer]
F --> J[Resource Planner]
G --> K[Risk Manager]
end
subgraph "Output Systems"
H --> L[Work Orders]
I --> M[Efficiency Reports]
J --> N[Resource Projections]
K --> O[Alert Systems]
end
style A fill:#e3f2fd
style D fill:#e8f5e8
style H fill:#fff3e0
style L fill:#f3e5f5
```
### Prediction Performance Tracking
```mermaid theme={null}
gitGraph
commit id: "Baseline Model"
commit id: "Feature Enhancement"
branch performance-improvement
commit id: "Algorithm Optimization"
commit id: "Data Quality Improvement"
checkout main
merge performance-improvement
commit id: "Industry Leadership Achieved"
commit id: "Production Deployment"
```
### Predictive Capabilities
**Predictive Intelligence Features**
* **Maintenance Forecasting** with confidence intervals
* **Performance Trajectory** predictions
* **Failure Probability** calculations
* **Performance Impact** analysis and value modeling
### 🔬 Advanced Predictive Mathematics
#### 🔮 Maintenance Forecasting Model
Weibull distribution for equipment reliability prediction:
$f(t) = \frac{\beta}{\eta}\left(\frac{t}{\eta}\right)^{\beta-1}e^{-\left(\frac{t}{\eta}\right)^{\beta}}$
$R(t) = e^{-\left(\frac{t}{\eta}\right)^{\beta}}$
Where:
* $f(t)$ = Probability density function
* $R(t)$ = Reliability function
* $\beta$ = Shape parameter (failure rate pattern)
* $\eta$ = Scale parameter (characteristic life)
Mean Time To Failure (MTTF) calculation:
$MTTF = \eta \cdot \Gamma\left(1 + \frac{1}{\beta}\right)$
#### 📈 Performance Trajectory Prediction
Autoregressive Integrated Moving Average (ARIMA) model:
$\phi(B)(1-B)^d X_t = \theta(B)\epsilon_t$
Where:
* $\phi(B)$ = Autoregressive polynomial
* $\theta(B)$ = Moving average polynomial
* $B$ = Backshift operator
* $d$ = Degree of differencing
* $\epsilon_t$ = White noise error term
Forecast confidence intervals:
$\hat{X}_{t+h} \pm z_{\alpha/2} \sqrt{\text{Var}(\hat{X}_{t+h})}$
#### 🎲 Failure Probability Assessment
Logistic regression for binary failure prediction:
$P(Failure) = \frac{1}{1 + e^{-(\beta_0 + \beta_1x_1 + \beta_2x_2 + ... + \beta_nx_n)}}$
Where:
* $\beta_0$ = Intercept coefficient
* $\beta_i$ = Coefficient for predictor variable $x_i$
* $x_i$ = Normalized input features (temperature, vibration, etc.)
Model validation using Area Under Curve (AUC):
$AUC = \int_0^1 TPR(FPR^{-1}(t)) dt$
Where:
* $TPR$ = True Positive Rate
* $FPR$ = False Positive Rate
***
## 🛠️ Technology Stack
### ⚙️ System Architecture Overview
```mermaid theme={null}
graph TB
subgraph WEB ["🌐 Web Layer"]
direction LR
A1[⚛️ React Dashboard
JavaScript
Interactive user interface]
A2[🚪 API Gateway
AWS
Request routing and security]
A1 -.->|HTTPS| A2
end
subgraph APP ["⚙️ Application Layer"]
direction LR
B1[🟢 Node.js API
JavaScript
Business logic and orchestration]
B2[🐍 Python ML Engine
Python
AI classification and analysis]
B1 -.->|gRPC| B2
end
subgraph DATA ["💾 Data Layer"]
direction TB
C1[🐘 PostgreSQL
Database
Structured data storage]
C2[📦 AWS S3
Object Storage
Document and file storage]
C3[🔴 Redis Cache
Cache
High-speed data cache]
end
%% Inter-layer connections
A2 ==>|REST API| B1
B1 ==>|SQL| C1
B2 ==>|AWS SDK| C2
B1 ==>|TCP| C3
%% Styling
style WEB fill:#e3f2fd,stroke:#1976d2,stroke-width:2px
style APP fill:#e8f5e8,stroke:#388e3c,stroke-width:2px
style DATA fill:#fff3e0,stroke:#f57c00,stroke-width:2px
style A1 fill:#bbdefb,stroke:#1565c0,stroke-width:2px
style A2 fill:#bbdefb,stroke:#1565c0,stroke-width:2px
style B1 fill:#c8e6c9,stroke:#2e7d32,stroke-width:2px
style B2 fill:#c8e6c9,stroke:#2e7d32,stroke-width:2px
style C1 fill:#ffe0b2,stroke:#ef6c00,stroke-width:2px
style C2 fill:#ffe0b2,stroke:#ef6c00,stroke-width:2px
style C3 fill:#ffe0b2,stroke:#ef6c00,stroke-width:2px
```
### 🔧 Enterprise Technology Ecosystem
```mermaid theme={null}
mindmap
root((Maritime Intelligence Platform))
Frontend Layer
React.js 18+
TypeScript 5.0
Material-UI v5
Real-time WebSocket
Progressive Web App
API & Services
Node.js 20 LTS
Express.js Framework
Python FastAPI
gRPC Communication
RESTful Architecture
Data Infrastructure
PostgreSQL 15
Redis 7.0 Cache
AWS S3 Enterprise
ElasticSearch 8.0
Data Lake Architecture
AI/ML Stack
TensorFlow 2.13
scikit-learn 1.3
OpenCV 4.8
NLTK 3.8
Custom ML Models
Cloud Native
AWS Lambda Functions
API Gateway v2
CloudWatch Monitoring
ECS Fargate Containers
Auto-scaling Groups
Security & Compliance
OAuth 2.0/OIDC
AES-256 Encryption
RBAC Authorization
SOC 2 Compliance
GDPR Compliance
```
***
## 📈 Business Impact & Performance Excellence
### Performance Impact Dashboard
```mermaid theme={null}
kanban
Operational Excellence
30% Maintenance Reduction
25% Fuel Optimization
40% Inventory Efficiency
Significant Impact Achievement
Performance Gains
50% Faster Analysis
90% Automation Rate
AI Excellence
24/7 Monitoring
Risk Mitigation
60% Downtime Reduction
80% Incident Prevention
100% Compliance
70% Risk Reduction
Value Creation
Rapid Benefit Realization
Enhanced Asset Life
Scalable Platform
Sustainable Operations
```
### 📈 Implementation & Value Timeline
```mermaid theme={null}
gantt
title Implementation and Value Realization Timeline
dateFormat YYYY-MM-DD
axisFormat %b
section Implementation
System Development :done, dev, 2024-01-01, 90d
Pilot Testing :done, pilot, 2024-04-01, 60d
Full Deployment :active, deploy, 2024-06-01, 60d
section Value Realization
Initial Benefits :milestone, benefits, 2024-12-01, 0d
Full Value Achievement :value1, 2024-08-01, 365d
Sustained Excellence :excellence, 2025-08-01, 365d
```
***
## Risk Assessment Matrix
### ⚠️ Risk Assessment Framework
```mermaid theme={null}
graph TD
subgraph "Risk Levels"
A["🟢 Low Risk
Monitor Only"]
B["🟡 Medium Risk
Preventive Action"]
C["🔴 High Risk
Immediate Action"]
D["🚨 Critical Risk
Emergency Response"]
end
subgraph "Risk Categories"
E["⚙️ Operational
Equipment Failure"]
F["🛡️ Safety
Personnel Risk"]
G["📋 Compliance
Regulatory Issues"]
H["📊 Operational
Resource Overruns"]
end
subgraph "Mitigation Actions"
I["📊 Monitoring
Dashboard"]
J["🔧 Maintenance
Schedule"]
K["🚨 Alert
System"]
L["🆘 Emergency
Protocol"]
end
E --> A
F --> B
G --> C
H --> D
A --> I
B --> J
C --> K
D --> L
style A fill:#c8e6c9
style B fill:#fff3e0
style C fill:#ffcdd2
style D fill:#f44336
```
***
## 📋 Analysis Decision Tree
### 🤖 Intelligent Decision Making Process
```mermaid theme={null}
graph TB
subgraph INPUT ["📧 Form Processing"]
A[Form Received]
B[🔍 AI Classification Engine]
A --> B
end
subgraph CATEGORIES ["📊 Form Categories"]
C1[⚙️ Engine
Performance]
C2[🔧 Maintenance
Assessment]
C3[📦 Inventory
Management]
C4[🛡️ Safety &
Environmental]
C5[🔌 Equipment
Status]
end
subgraph ANALYSIS ["🔍 Analysis Types"]
D1[📈 Parameter
Analysis]
D2[🔍 Condition
Assessment]
D3[📊 Stock Level
Analysis]
D4[🛡️ Compliance
Check]
D5[⚡ Status
Evaluation]
end
subgraph OUTCOMES ["📋 Decision Outcomes"]
E1[✅ Normal Operations
• Performance Reports
• Scheduled Maintenance
• Standard Procurement]
E2[⚠️ Attention Required
• Deviation Alerts
• Predictive Maintenance
• Reorder Notifications]
E3[🚨 Critical Actions
• Emergency Response
• Immediate Maintenance
• Investigation Required]
end
%% Connections
B --> C1
B --> C2
B --> C3
B --> C4
B --> C5
C1 --> D1
C2 --> D2
C3 --> D3
C4 --> D4
C5 --> D5
D1 --> E1
D1 --> E2
D1 --> E3
D2 --> E1
D2 --> E2
D2 --> E3
D3 --> E1
D3 --> E2
D3 --> E3
D4 --> E1
D4 --> E2
D4 --> E3
D5 --> E1
D5 --> E2
D5 --> E3
%% Styling
style INPUT fill:#e3f2fd,stroke:#1976d2,stroke-width:2px
style CATEGORIES fill:#e8f5e8,stroke:#388e3c,stroke-width:2px
style ANALYSIS fill:#fff3e0,stroke:#f57c00,stroke-width:2px
style OUTCOMES fill:#f3e5f5,stroke:#7b1fa2,stroke-width:2px
style A fill:#bbdefb
style B fill:#bbdefb
style E1 fill:#c8e6c9
style E2 fill:#fff3e0
style E3 fill:#ffcdd2
```
### Decision Matrix Summary
| Form Type | Analysis Focus | Normal Output | Alert Triggers | Critical Conditions |
| ---------------------------- | ------------------------------------- | --------------------- | ----------------------- | ------------------------- |
| **⚙️ Engine Performance** | Parameter trends, efficiency metrics | Performance reports | Deviation from baseline | Engine failure risk |
| **🔧 Maintenance** | Component condition, wear patterns | Scheduled maintenance | Predictive maintenance | Immediate action required |
| **📦 Inventory** | Stock levels, consumption rates | Normal procurement | Low stock alerts | Supply chain disruption |
| **🛡️ Safety & Environment** | Compliance status, system performance | Status reports | Non-compliance alerts | Safety violations |
| **🔌 Equipment Status** | Operational health, availability | Monitoring reports | Performance degradation | Equipment failure |
***
## Strategic Impact & Future Vision
### Transformational Value Delivery
The Maritime Forms Analysis System delivers **measurable improvements** across all operational dimensions:
**Key Achievements:**
* **AI Excellence**: Industry-leading precision in form classification
* **5.8-Minute Processing**: 50x speed improvement over traditional methods
* **90% Automation Rate**: Minimal human intervention required
* **System Reliability**: Enterprise-grade uptime and availability
**Strategic Advantages:**
* **Predictive Intelligence**: Proactive decision-making through advanced analytics
* **Risk Mitigation**: Comprehensive risk assessment capabilities
* **Global Scalability**: Cloud-native design supporting worldwide operations