> ## Documentation Index
> Fetch the complete documentation index at: https://www.siya.com/llms.txt
> Use this file to discover all available pages before exploring further.
# Lube Oil Management
 ## 1. Lube Oil Overview
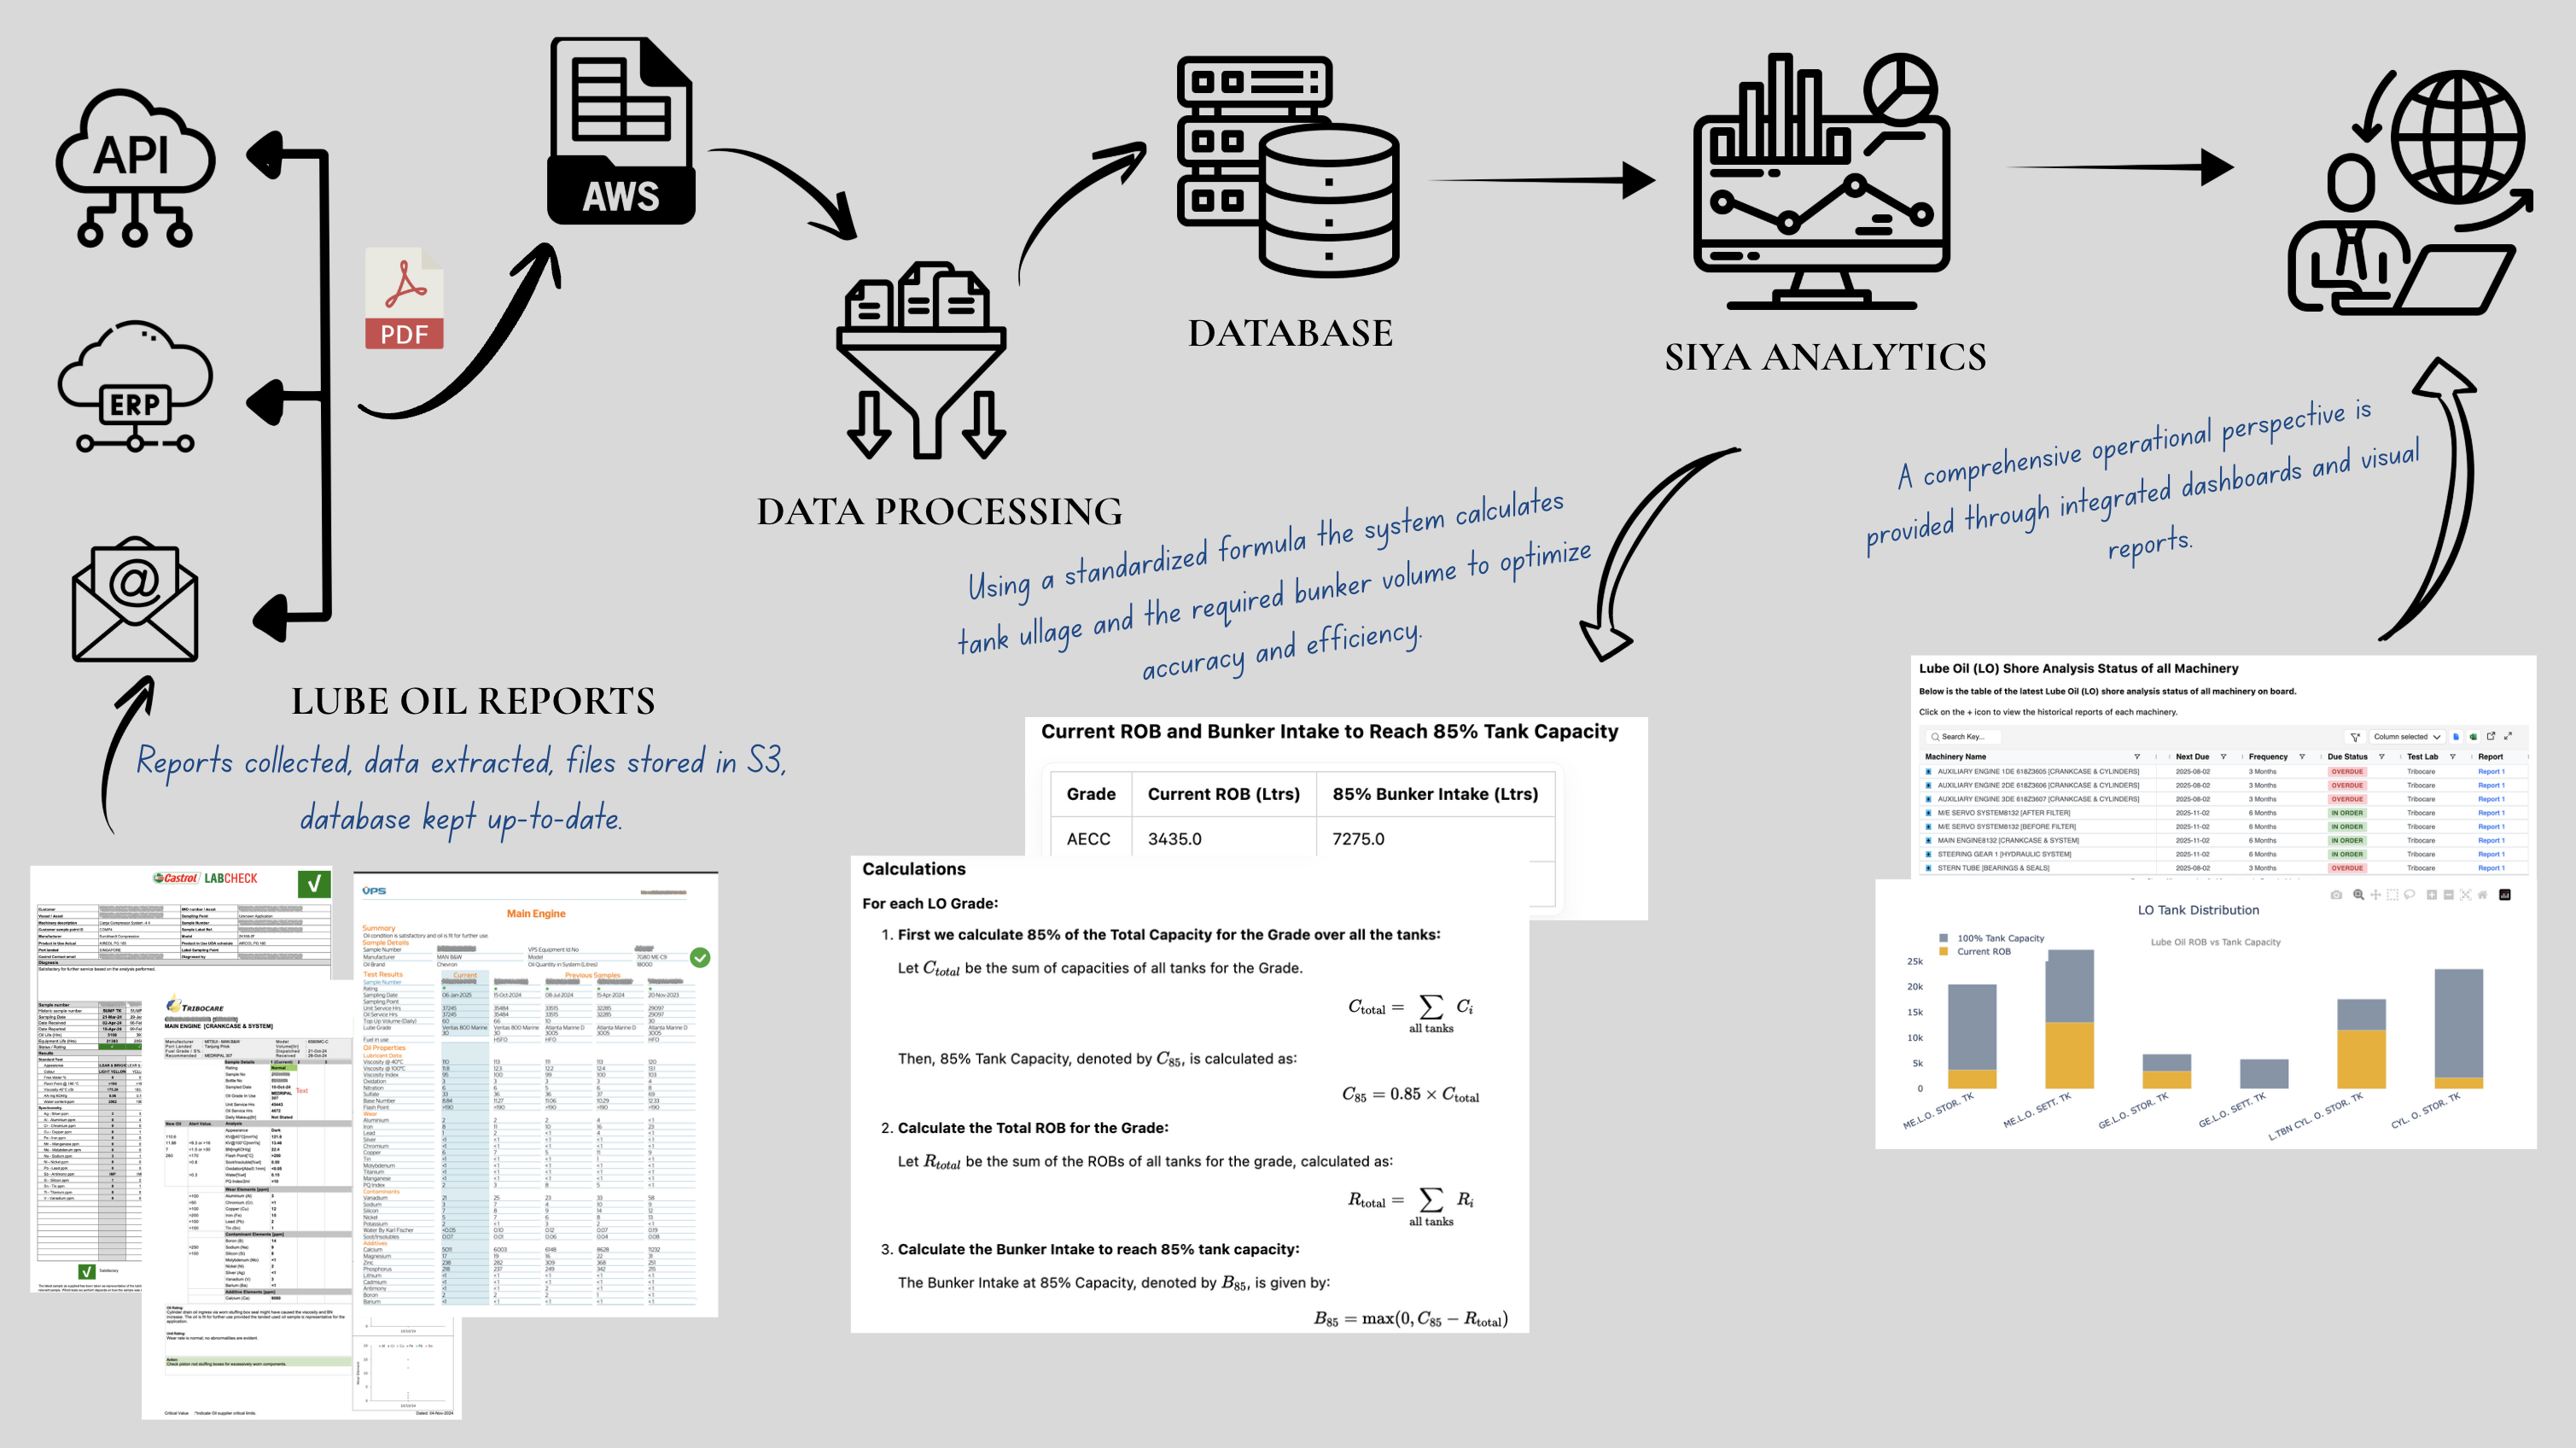
This module provides a comprehensive, high-level overview of the entire lube oil analysis process, covering the **Lube Oil Shore Analysis status of all machineries and the Lube Oil Tank Distribution and Capacity.** These dashboards are specifically designed to keep track of lube oil quality and inventory, enabling proactive maintenance and optimizing bunker operations.
The lube oil dashboard gives users the ability to **follow up on when to submit the next samples for each piece of machinery, check the status of the last submitted samples,** and access all corresponding reports.
The flowchart below illustrates the data pipeline, showing how data is ingested from various sources, processed, stored, and ultimately presented in the dashboards.
```mermaid theme={null}
graph TD
%% Define the theme for darker fonts and a yellow background
%%{init: {'theme': 'base', 'themeVariables': { 'primaryColor': '#a2d2ff', 'textColor': '#212529', 'lineColor': '#333'}}}%%
subgraph "Input Sources"
direction LR
A[API]
B[Mail]
C[ERP]
end
subgraph "Data Processing"
D[ETL Process]
end
subgraph "Data Storage"
direction LR
E[MongoDB]
F[Amazon S3 Bucket for Reports]
end
subgraph "Dashboards"
direction LR
G[Lube Oil Shore Analysis Status]
H[Lube Oil Tank Distribution & Capacities]
end
style A fill:#ffc8dd
style B fill:#ffc8dd
style C fill:#ffc8dd
style D fill:#cdb4db
style E fill:#bde0fe
style F fill:#bde0fe
style G fill:#a2d2ff
style H fill:#a2d2ff
A --> D
B --> D
C --> D
D --> E
D -- "Downloads and Stores Reports" --> F
E --> G
E --> H
```
***
## 2. Data Sources
The Lube Oil Management Module integrates data from multiple sources to provide a single, unified view:
* **Database**: Contains all vessel information and the overall lube oil dataset.
* **Laboratory Results**: Lube oil analysis reports are sourced directly from Castrol, Chevron, Gulf, Shell, and other certified labs.
* **Consumption Log API**: Provides real-time consumption and Remaining on Board (ROB) data.
* **S3 Storage**: Securely stores all downloaded lube oil reports for easy access.
### Automated Report Processing
A key feature of our platform is its ability to intelligently process PDF lab reports received via email or API, eliminating the need for manual data entry.
## 1. Lube Oil Overview
This module provides a comprehensive, high-level overview of the entire lube oil analysis process, covering the **Lube Oil Shore Analysis status of all machineries and the Lube Oil Tank Distribution and Capacity.** These dashboards are specifically designed to keep track of lube oil quality and inventory, enabling proactive maintenance and optimizing bunker operations.
The lube oil dashboard gives users the ability to **follow up on when to submit the next samples for each piece of machinery, check the status of the last submitted samples,** and access all corresponding reports.
The flowchart below illustrates the data pipeline, showing how data is ingested from various sources, processed, stored, and ultimately presented in the dashboards.
```mermaid theme={null}
graph TD
%% Define the theme for darker fonts and a yellow background
%%{init: {'theme': 'base', 'themeVariables': { 'primaryColor': '#a2d2ff', 'textColor': '#212529', 'lineColor': '#333'}}}%%
subgraph "Input Sources"
direction LR
A[API]
B[Mail]
C[ERP]
end
subgraph "Data Processing"
D[ETL Process]
end
subgraph "Data Storage"
direction LR
E[MongoDB]
F[Amazon S3 Bucket for Reports]
end
subgraph "Dashboards"
direction LR
G[Lube Oil Shore Analysis Status]
H[Lube Oil Tank Distribution & Capacities]
end
style A fill:#ffc8dd
style B fill:#ffc8dd
style C fill:#ffc8dd
style D fill:#cdb4db
style E fill:#bde0fe
style F fill:#bde0fe
style G fill:#a2d2ff
style H fill:#a2d2ff
A --> D
B --> D
C --> D
D --> E
D -- "Downloads and Stores Reports" --> F
E --> G
E --> H
```
***
## 2. Data Sources
The Lube Oil Management Module integrates data from multiple sources to provide a single, unified view:
* **Database**: Contains all vessel information and the overall lube oil dataset.
* **Laboratory Results**: Lube oil analysis reports are sourced directly from Castrol, Chevron, Gulf, Shell, and other certified labs.
* **Consumption Log API**: Provides real-time consumption and Remaining on Board (ROB) data.
* **S3 Storage**: Securely stores all downloaded lube oil reports for easy access.
### Automated Report Processing
A key feature of our platform is its ability to intelligently process PDF lab reports received via email or API, eliminating the need for manual data entry.
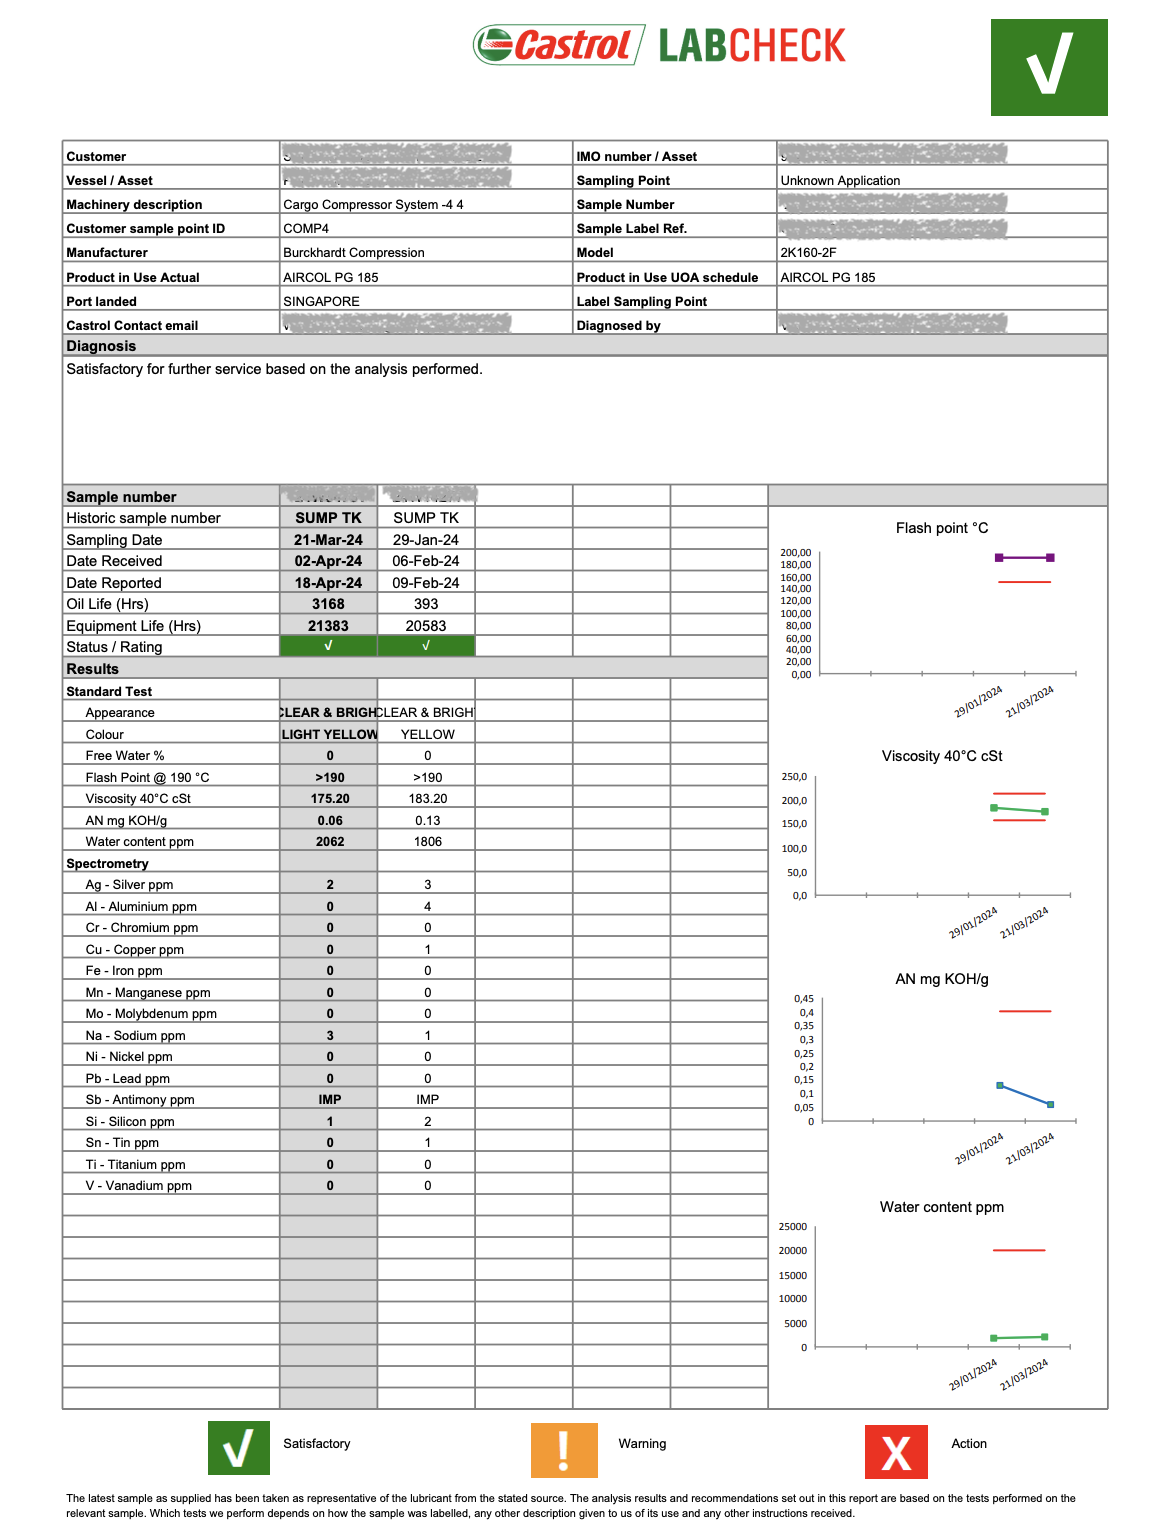 Our system uses the following automated process:
* **Intelligent Document Recognition**: It automatically identifies and reads incoming lab reports. If a single report contains results for multiple machineries, it is intelligently split machinery-wise before the next step.
* **Automated Data Extraction**: It extracts the required data with the given structure of necessary data from the PDF such as machinery name, IMO, sample number, vessel name, report status, report date, and sample details.
* **Data Storage and Archiving**: Finally, the extracted data will be saved to the database, and the report is being uploaded to S3 machinery-wise for easy access.
***
## 3. Features & Logic
The flowchart below details the core data processing logic. After data is extracted, parallel workflows are executed to generate the final dashboard outputs.
```mermaid theme={null}
graph TD
%%{init: {'theme': 'base', 'themeVariables': { 'textColor': '#000000'}}}%%
A[Start: ERP System] --> B[Download & Extract Data];
subgraph "Path 1: Shore Analysis Logic"
direction TB
B --> C{Get Latest Sample Details};
C --> D[Calculate Next Due Date];
D --> E[Determine Report Status];
E --> F[Determine Due Status];
F --> J[Shore Analysis Status Dashboard];
end
subgraph "Path 2: Tank Capacity & Bunker Logic"
direction TB
B --> G["Calculate 85% Capacity
Our system uses the following automated process:
* **Intelligent Document Recognition**: It automatically identifies and reads incoming lab reports. If a single report contains results for multiple machineries, it is intelligently split machinery-wise before the next step.
* **Automated Data Extraction**: It extracts the required data with the given structure of necessary data from the PDF such as machinery name, IMO, sample number, vessel name, report status, report date, and sample details.
* **Data Storage and Archiving**: Finally, the extracted data will be saved to the database, and the report is being uploaded to S3 machinery-wise for easy access.
***
## 3. Features & Logic
The flowchart below details the core data processing logic. After data is extracted, parallel workflows are executed to generate the final dashboard outputs.
```mermaid theme={null}
graph TD
%%{init: {'theme': 'base', 'themeVariables': { 'textColor': '#000000'}}}%%
A[Start: ERP System] --> B[Download & Extract Data];
subgraph "Path 1: Shore Analysis Logic"
direction TB
B --> C{Get Latest Sample Details};
C --> D[Calculate Next Due Date];
D --> E[Determine Report Status];
E --> F[Determine Due Status];
F --> J[Shore Analysis Status Dashboard];
end
subgraph "Path 2: Tank Capacity & Bunker Logic"
direction TB
B --> G["Calculate 85% Capacity
C(85) = Capacity * 0.85"];
G --> H["Calculate Ullage
Ullage = Capacity - ROB"];
H --> I["Calculate Bunker Intake
Intake = max(0, C(85) - ROB)"];
I --> K[Tank Distribution & Capacities Dashboard]
end
%% Styling
style A fill:#ffc8dd,stroke:#333
style B fill:#cdb4db,stroke:#333
style C fill:#bde0fe,stroke:#333
style D fill:#bde0fe,stroke:#333
style E fill:#bde0fe,stroke:#333
style F fill:#bde0fe,stroke:#333
style G fill:#c9f8d3,stroke:#333
style H fill:#c9f8d3,stroke:#333
style I fill:#c9f8d3,stroke:#333
style J fill:#a2d2ff,stroke:#333
style K fill:#a2d2ff,stroke:#333
```
***
### Explanation of the Logic
The process begins by **downloading and extracting data** from all incoming reports from the ERP system. From there, the logic splits into two parallel paths:
#### Path 1: Shore Analysis Logic
This path focuses on determining the health of the machinery based on the latest lab reports.
1. **Initial Data Processing**: The system begins by processing all available lube oil analysis data for the vessel. This data is grouped by `machineryName` to consolidate all reports for each specific piece of machinery.
2. **Isolate Latest Report**: For each machinery group, the system identifies the most recent lab report based on the `sampleDate`. This ensures the dashboard always displays the most current status.
3. **Core Calculations for Each Machinery**: For every latest report, the system performs a series of calculations to determine its status:
* **Next Due Date**: It establishes the deadline for the next sample by adding a predefined frequency (e.g., 90 days for 3 months, 180 days for 6 months) to the `sampleDate` of the current report.
* **Report Status Categorization**: The status provided in the lab report is categorized for immediate visual assessment on the dashboard.
* **Due Status Calculation**: Using the `Next Due Date`, a time-sensitive status is calculated to guide user action.
| Condition | Status |
| :------------------------------------------ | :------- |
| If `Next Due` is **more than 30 days** away | IN ORDER |
| If `Next Due` is **within 30 days** | DUE |
| If `Next Due` has **already passed** | OVERDUE |
***
#### Path 2: Tank Capacity & Bunker Logic
This path focuses on inventory management and provides actionable recommendations for bunkering, using data from the vessel's consumption logs.
1. **Initial Data Processing**: The system begins by processing the latest consumption log data for the vessel. This log contains a detailed list of all lube oil tanks, their total `capacity`, and their `currentRob` (Remaining on Board).
2. **Core Calculations for Each Tank**: For every individual tank, the system performs a series of calculations to assess its current state and needs:
* **Optimal Capacity ($C_{85}$)**: The target stock level is calculated as 85% of the tank's total capacity.
$$
C_{85} = C_{\text{total}} \times 0.85
$$
* **Ullage**: The current available space in the tank.
$$
\text{Ullage} = C_{\text{total}} - R_{\text{current}}
$$
* **Bunker Intake ($B_{85}$)**: The precise amount of oil to bunker to reach the 85% target.
$$
B_{85} = \max(0, C_{85} - R_{\text{current}})
$$
3. **Aggregation by Lube Oil Grade**: While per-tank data is useful for on-board management, purchasing decisions are made by oil grade. The system therefore aggregates the `Bunker Intake` values for all tanks of the same grade (e.g., all 'AECC' tanks) to provide a total required quantity for each type of oil.
4. **Multi-Level Dashboard Output**: The final, processed data is presented in multiple ways to serve different needs:
* **A visual bar chart** showing the `currentRob` vs. `capacity` for each individual tank.
* **A summary table** showing the total recommended `Bunker Intake` for each lube oil grade, perfect for procurement.
* **A detailed data table** with a full breakdown of all metrics for every tank.
***
## 4. Key Takeaways
This module turns complex data into confident decisions, empowering you to:
* **Instantly Track** the health of all machinery with an at-a-glance shore analysis status.
* **Proactively Manage** maintenance schedules by tracking sample due dates to prevent failures.
* **Optimize Inventory** with data-driven recommendations for bunker intake, reducing waste and cutting costs.
* **Drive Peak Performance** across the fleet with a single, unified view of your entire lube oil operation.