

Marine Auxiliary Engine Performance – Methodology Guide
This document explains how the AI-enhanced application evaluates a vessel’s auxiliary engine performance using shop trial references and real-time operational data with intelligent diagnostic capabilities.System Workflow Overview
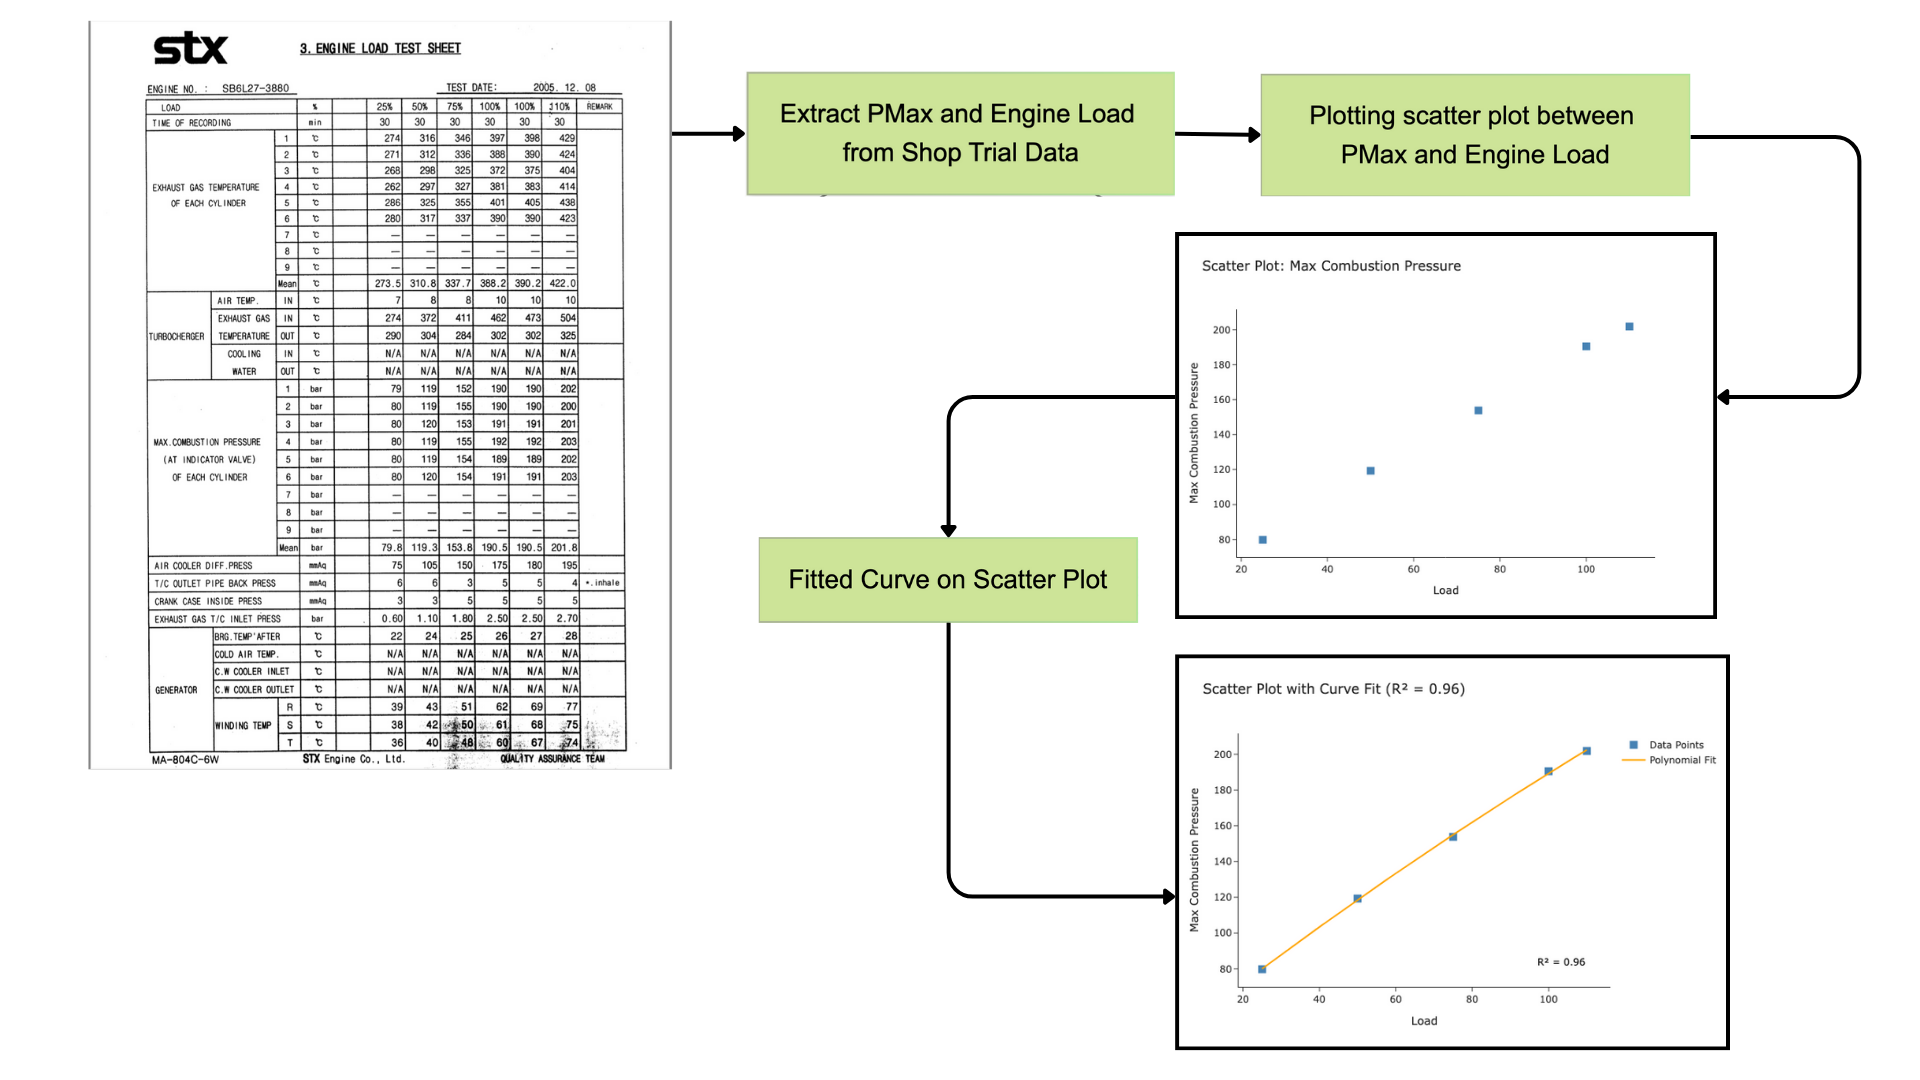
Data Sources and System Foundation
- Shop trial reference: For each auxiliary engine, we maintain baseline performance values established during factory acceptance testing. These represent optimal engine behavior under standardized conditions when the engine was in reference condition.
- Real-time operational data: For each selected month, we retrieve the vessel’s recorded auxiliary engine operating data (fuel pump rack position, boost air pressure, turbocharger temperatures, exhaust temperature, maximum combustion pressure). These are the actual operational measurements.
- AI analysis database: Comprehensive diagnostic results stored in MongoDB collections to eliminate redundant processing and provide instant retrieval of previously analyzed scenarios.
Critical Parameters Assessment
The auxiliary engine dashboard monitors six critical parameters:- Fuel Pump Rack Position
- Boost Air Pressure
- Turbocharger Inlet Temperature
- Turbocharger Outlet Temperature
- Exhaust Gas Temperature
- Maximum Combustion Pressure
Shop Trial Reference Methodology
- For each parameter, we retrieve the vessel’s shop trial baseline value that represents expected performance under standard operating conditions.
- These baselines serve as the gold standard for performance comparison.
- All auxiliary engines of the same type maintain consistent shop trial references, ensuring standardized comparison across similar installations.
Environmental Normalization (ISO Correction)
To ensure valid comparison between operational data and the engine’s baseline shop trial performance, measured values must be adjusted to standard ambient conditions. This normalization follows marine engineering standards for critical parameters. The primary variables considered for adjustment are:- Charge Air Temperature ()
- Cooling Water Temperature ()
- Reference Temperature ()
Correction Model for Maximum Combustion Pressure ()
The observed maximum combustion pressure is sensitive to temperature variations. The correction formula adjusts the observed value based on temperature deviations from the reference condition. Where: Correction Constants:- (baseline correction factor)
- (air temperature correction coefficient)
- (cooling temperature correction coefficient)
- (ISO reference temperature)
Correction Model for Boost Air Pressure ()
Similar correction methodology applies to boost air pressure with specialized coefficients: Specialized Constants:- (boost pressure baseline factor)
- (air temperature coefficient for boost pressure)
- (cooling temperature coefficient for boost pressure)
Performance Deviation Analysis
For each parameter, we take the measured value (or ISO corrected value where applicable) and the shop trial baseline value. We then compute the percentage difference between the two, which we call the deviation. The formula used is: Color coding used throughout the application:- Green: within ±5% of reference (normal operation)
- Yellow: between ±5% and ±10% deviation (caution - monitoring required)
- Red: beyond ±10% deviation (critical - immediate attention required)
Parameter Card Information Display
Each parameter card shows:- ISO corrected value (environmental correction applied for Pmax and Boost Air Pressure)
- Measured value (raw operational measurement from engine sensors)
- Shop trial value (expected baseline performance reference)
- Deviation and color classification with directional indicators
- AI Insight (intelligent diagnostic recommendation specific to the parameter)
- A performance chart: measured vs. shop trial comparison visualization
- A trend chart of deviation over time, with configurable date ranges
AI-Enhanced Diagnostic System
- Individual Parameter Analysis: Each parameter receives dedicated AI diagnostic analysis, providing concise technical insights (1-2 sentences) with contextual guidance.
- Comprehensive System Analysis: Multi-parameter integration analyzes all six parameters simultaneously using 12 chart images (6 parameters × 2 chart types) to identify system-wide performance patterns and root causes.
Trend Analysis and Historical Context
The trend chart displays deviation percentages over configurable time ranges (6 months, 1 year, maximum history, or custom start/end), allowing identification of:- Performance degradation patterns indicating gradual drift from baseline values
- Operational anomalies suggesting specific events or component failures
- Maintenance effectiveness through performance improvements following interventions
Operational Interpretation Guidance
- Parameter interdependencies: Consider multiple parameters together for comprehensive assessment. For example, declining boost air pressure with increasing exhaust temperatures suggests turbocharger degradation.
- Trend context: Historical patterns provide crucial context for current measurements and operational decisions.
- Environmental factors: ISO corrections account for operational condition variations, ensuring accurate baseline comparison.
Operational Response Protocols
- Red (>±10% deviation): Plan immediate investigation and corrective actions. Review corroborating parameters and recent trend direction. Schedule maintenance intervention.
- Yellow (±5% to ±10% deviation): Increase monitoring frequency. Schedule preventive maintenance or component inspection at next convenient opportunity.
Methodology Summary
- Normalize current measurements to standard conditions using ISO corrections.
- Compare them against the vessel’s own shop trial references.
- Classify the gap using marine engineering standard thresholds and display both current status and historical trends.
- Provide intelligent AI insights cached for efficiency and consistency.
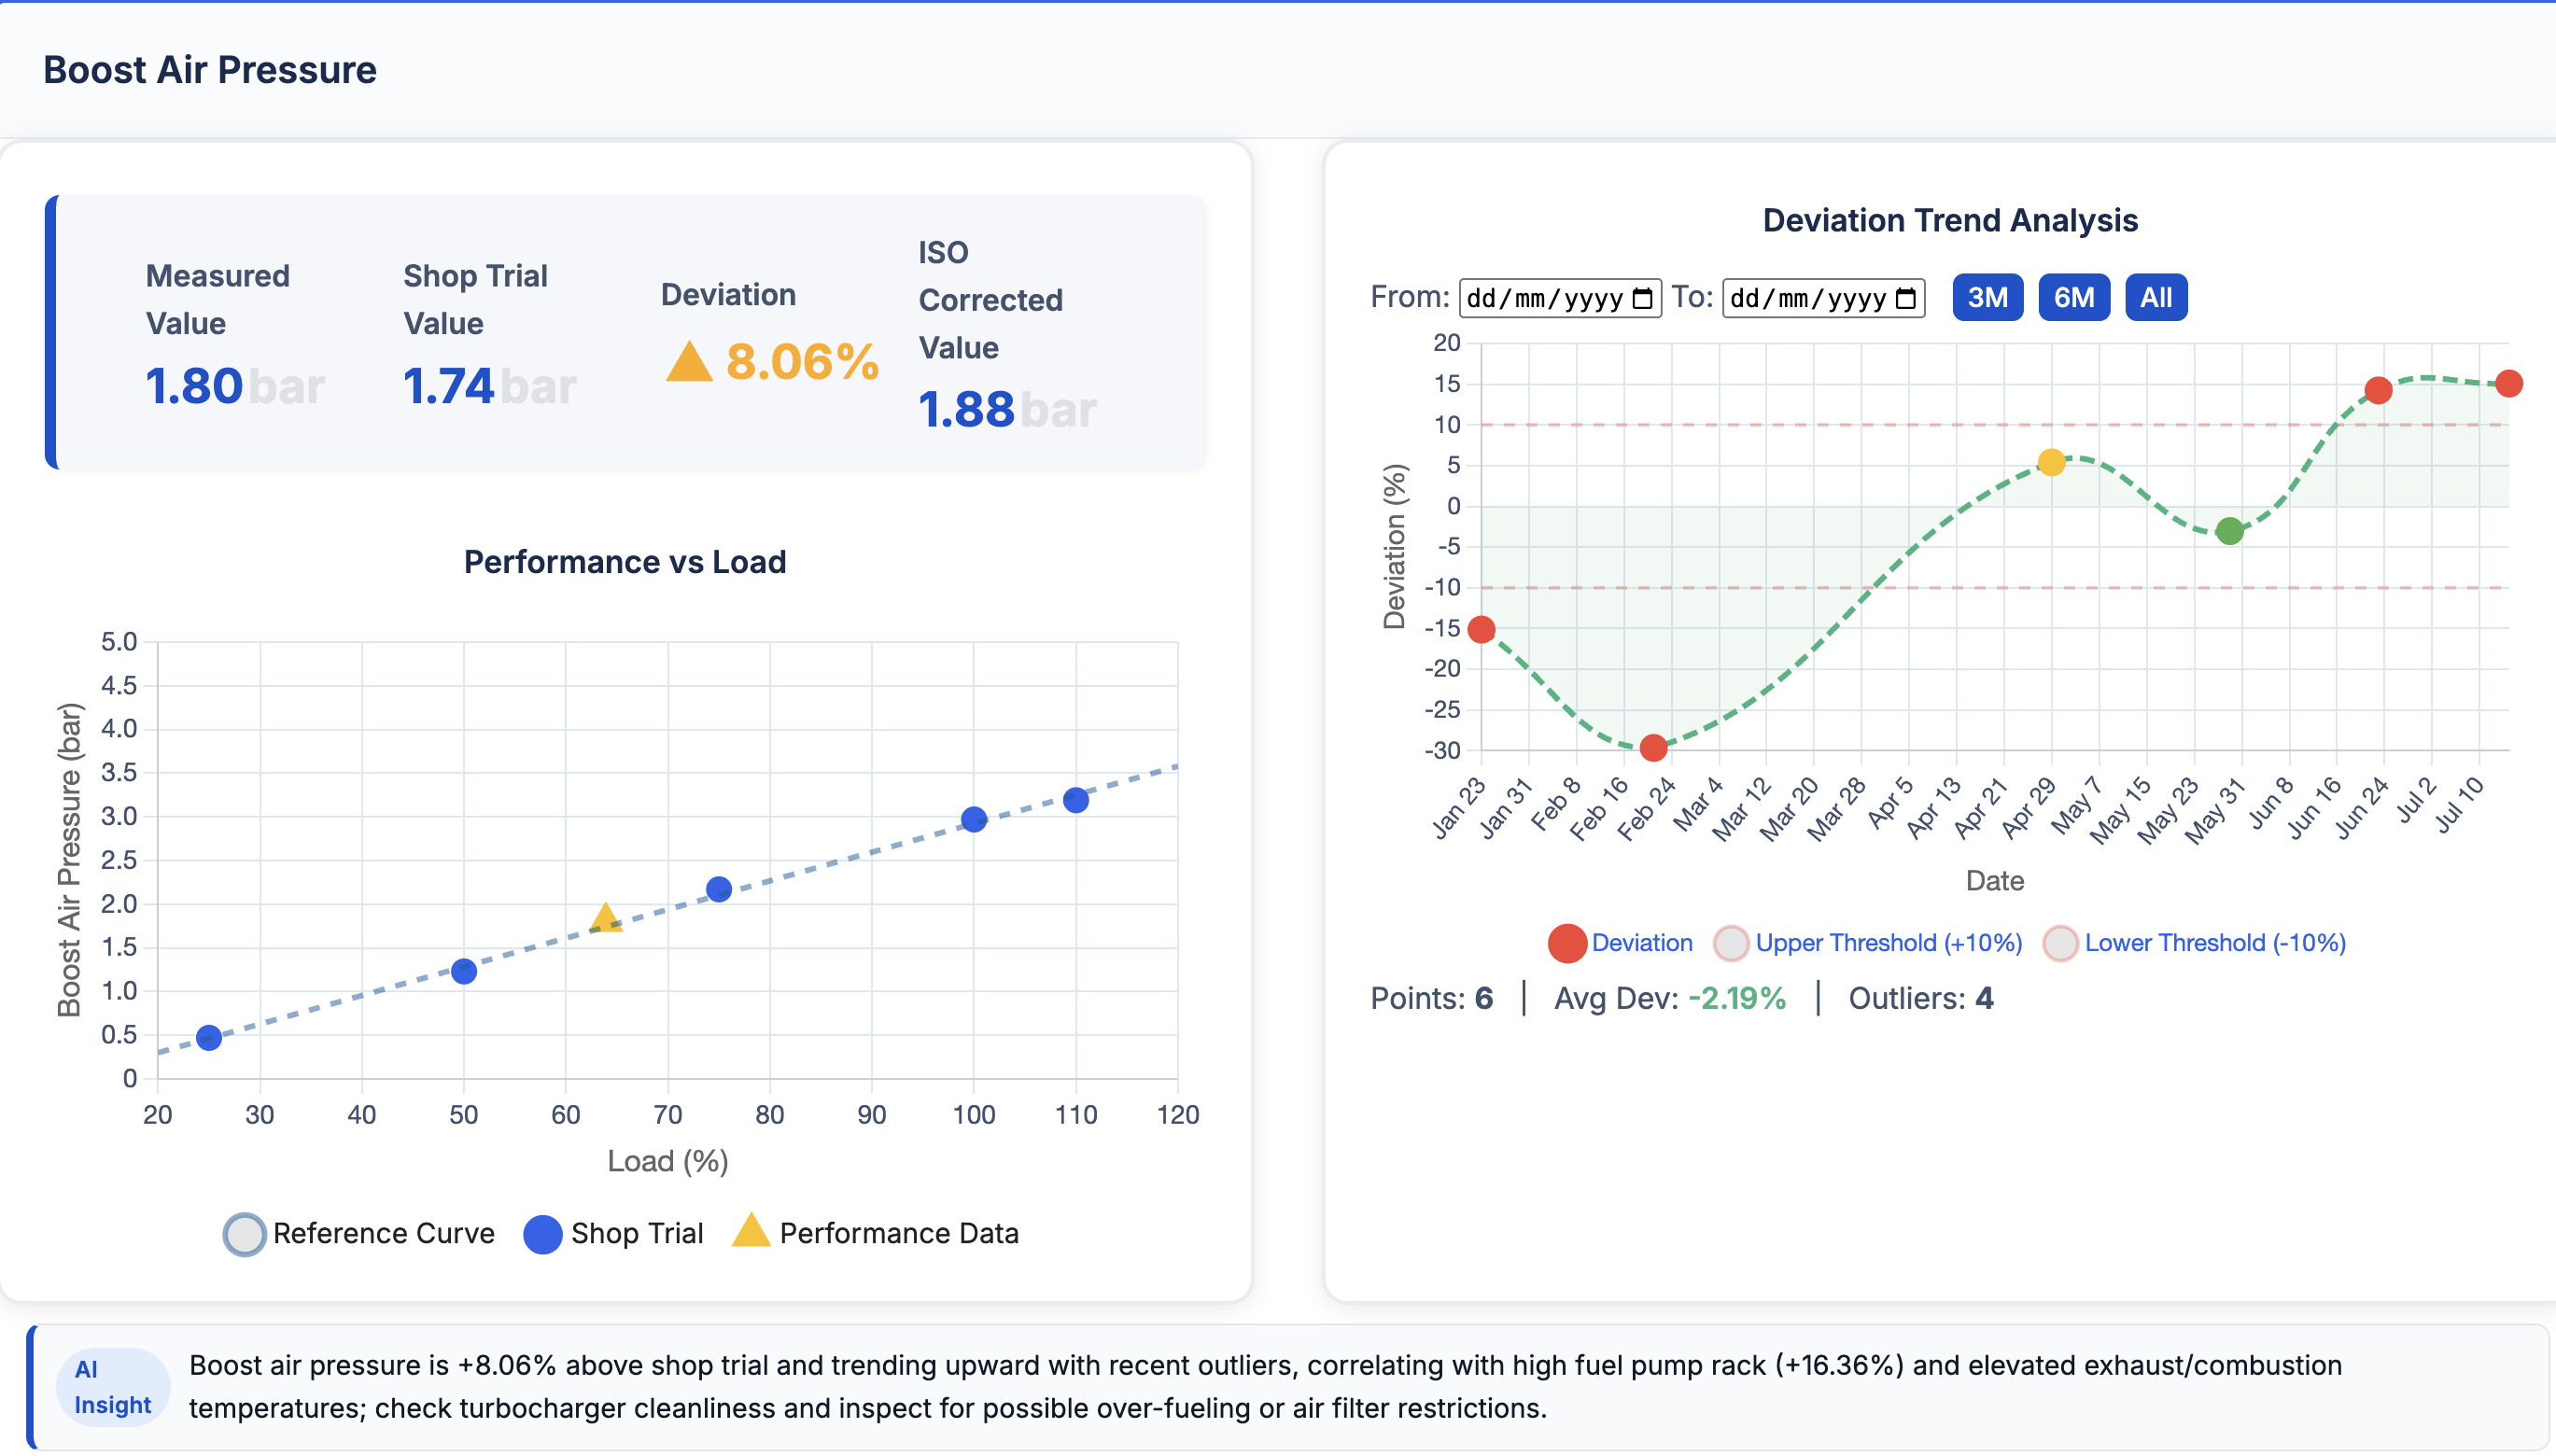
Illustrated example: Boost Air Pressure Analysis
- Title: Each parameter being assessed with clear identification.
- Four key metrics displayed:
- ISO Corrected Value: Environmental correction applied where applicable.
- Measured Value: Raw operational measurement from engine sensors.
- Shop Trial Value: Expected baseline from factory acceptance testing.
- Deviation: Percentage difference with color coding and directional arrows.
- AI Insight Badge: Intelligent diagnostic recommendation for each parameter.
- The charts: Performance visualization showing measured vs. shop trial comparison and historical trend analysis.
Deviation Calculation
Using the boost air pressure example from the dashboard: • Measured Value = 1.80 bar • Shop Trial Value = 1.74 bar • Environmental Conditions: , ISO Correction Process: First, convert measured pressure to MPa: Deviation Calculation: For parameters with ISO correction (boost air pressure and maximum combustion pressure), the system calculates deviation using the ISO corrected value against the shop trial baseline: This is displayed as 8.05% with an upward arrow indicating above reference, classified as Yellow (Caution) requiring monitoring and potential maintenance planning. AI Insight: “Boost air pressure is significantly above shop trial and trending further positive, suggesting possible over-fueling or turbocharger mismatch. Check turbocharger condition and verify fuel rack calibration for corrective action.”Color coding and actions (applies to all parameters and trends)
| Color | Deviation Range | Operational Meaning | Recommended Action |
|---|---|---|---|
| Green | within ±5% | Normal operation aligned with shop trial baseline | Continue routine monitoring; maintain current operational parameters |
| Yellow | >±5% and ≤±10% | Noticeable deviation requiring attention | Increase monitoring frequency; plan preventive maintenance at next opportunity |
| Red | >±10% | Significant deviation indicating potential issues | Prioritize investigation; implement corrective actions; monitor trend closely |
Parameter reference guide (auxiliary engine specific)
| Parameter | Unit | Comparison Baseline | Key Monitoring Points |
|---|---|---|---|
| Fuel Pump Rack | mm | Shop trial position at operating conditions | Rising trend may indicate increased fuel demand or injection system wear |
| Boost Air Pressure | bar | ISO-corrected shop trial curve | Low values with temperature increases suggest turbocharger degradation |
| T/C Inlet Temperature | °C | Shop trial baseline temperature | Elevated values affect combustion efficiency and indicate intake system issues |
| T/C Outlet Temperature | °C | Shop trial reference temperature | Monitor with boost pressure for turbocharger performance assessment |
| Exhaust Temperature | °C | Shop trial exhaust temperature | Rising trends indicate combustion efficiency changes or exhaust system issues |
| Max Combustion Pressure | bar | ISO-corrected shop trial pressure | Critical for mechanical integrity; monitor with fuel rack position |
How to read the trend charts
- A stable line near zero means the parameter consistently performs like the shop trial reference.
- A gradual trending pattern indicates systematic performance changes requiring attention.
- Sudden deviations may indicate operational events or component failures requiring investigation.
- Seasonal patterns should consider environmental factors and operational variations.
This methodology ensures reliable, efficient, and intelligent auxiliary engine performance monitoring that supports proactive maintenance strategies while optimizing operational costs and resource utilization.